
Support Resistance Zones
Indicator
1.81K downloads
Version 1.0, Apr 2025
Windows, Mac
5.0
Reviews: 4
Description
Summary
AI summary
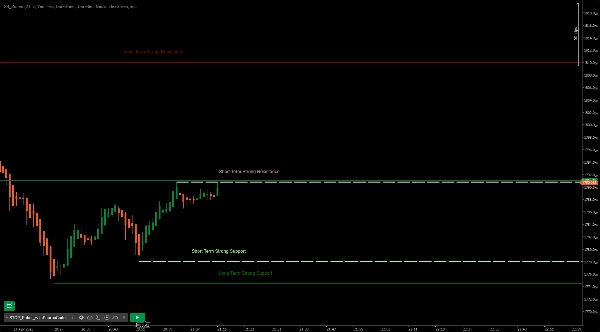
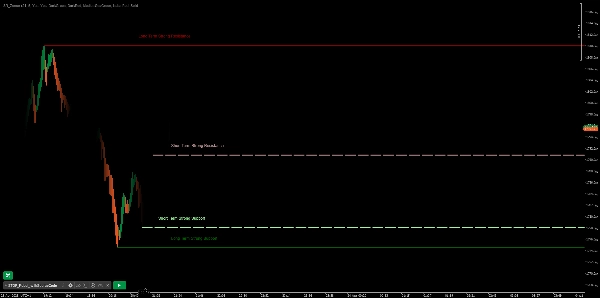
Support Resistance Zones is a trading indicator designed to identify key support and resistance levels on price charts. It distinguishes between short and long support/resistance zones and categorizes them as strong or minor resistance areas. This tool helps traders visualize critical price levels where market reversals or consolidations may occur, aiding in technical analysis and decision-making.
Indicator profile
Customer reviews
5.0
Reviews: 4
5 | 100 % | |
4 | 0 % | |
3 | 0 % | |
2 | 0 % | |
1 | 0 % |
Customer reviews
December 21, 2025
December 18, 2025
100% Amazing tool for a beginner like me who makes 90% Wins and 90% Losses, Now just Wins and losses because I get bored - Thank YOU so much for this tool.
July 14, 2025
Pros: Automatically detects support and resistance zones. Customizable and visually clear. Works across all timeframes. Cons: No alerts or tooltips. Lacks volume-based filtering and template saving. Needs confirmation tools for reliable signals.
Discussion
FAQ
Products available through cTrader Store, including trading bots, indicators and plugins, are provided by third-party developers and made available for informational and technical access purposes only. cTrader Store is not a broker and does not provide investment advice, personal recommendations or any guarantee of future performance.
!["[Stellar Strategies] Market Session Ultimate" logo](https://cdn.ctrader.com/image/webp/61ffd537-0125-4246-9e72-42eca1791d64_28232)


Price
Since 09/01/2025
11.78K
Free installs