Description
Lux-Style Trendlines With Breakouts – cTrader Indicator
Bring dynamic swing-based trendlines and breakout detection to your cTrader charts.
This indicator automatically detects pivot highs and pivot lows and builds two adaptive trendlines:
- Upper trendline (resistance)
- Lower trendline (support)
The lines are projected forward using a configurable slope calculation, helping you visualize trend structure in real time and identify potential breakout moments with clear “B” breakout signals.
✅ Key Features
- Automatic swing detection based on pivot highs/lows
- Dynamic trendline projection with adjustable slope multiplier
- 3 slope calculation methods:
- ATR
- Standard Deviation
- Linear Regression approximation
- Breakout signals when price breaks above/below the trendlines
- Optional extended lines for better trend visualization
- Clean and lightweight overlay indicator (ideal for scalping, swing, and trend trading)
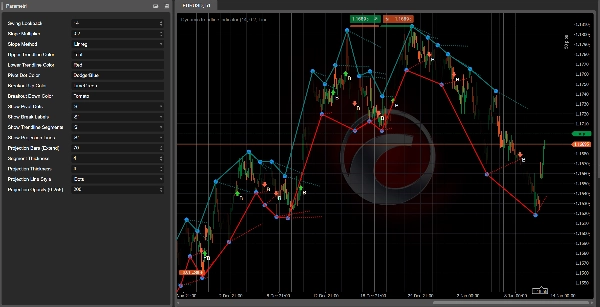
⚙️ Inputs / Settings
- Swing detection lookback period
- Slope multiplier
- Slope calculation method (ATR / Stdev / Linreg)
- Backpaint mode (for historical visualization)
- Extended line visualization ON/OFF
- Custom colors for Up/Down trendlines
🎯 Best Use Cases
- Identifying trend direction and structure
- Trading support/resistance breakouts
- Confirming entries with price action
- Trend continuation & reversal zones
⚠️ Important Note (Transparency)
Please note that there is already a similar cBot available on cTrader Store that follows a related logic to this indicator.
You can check it here:https://ctrader.com/it/products/2517?u=Labot
This product is an indicator designed for chart analysis and manual confirmation, while the referenced product is a cBot (automated trading system).