Description
Adaptive Trailing System 🚀
The Adaptive Trailing System is an advanced adaptive trailing stop that uses logarithmic normalized volatility to automatically adjust profit protection levels. 📊 Unlike traditional trailing stops with fixed distances, this system calculates dynamic distances based on the market's actual volatility, constantly adapting to changing conditions. 🔄
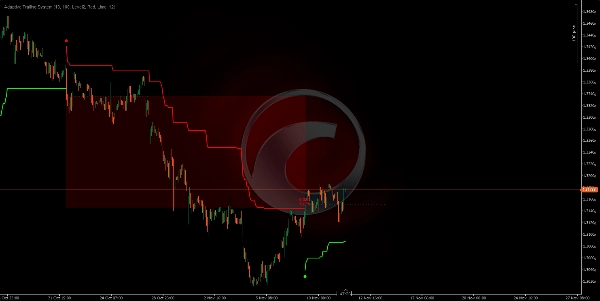
Spotware GBPUSD 691360763c684 | cTrader
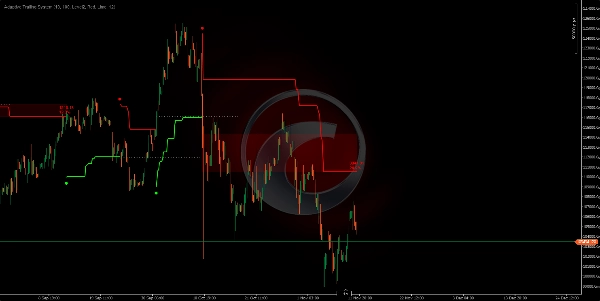
Spotware XAUUSD 691360adf1386 | cTrader
Spotware XAUUSD 691360adf1386 | cTrader
Unique Adaptive Trailing Algorithm ⚙️
The system uses a statistical method that never generates the same trailing distances:
• Calculates the True Range of the price over a configurable period.
• Applies a logarithmic transformation to these values to normalize the distribution.
• Calculates the mean and standard deviation of these logarithmic values.
• Generates a unique offset distance based on volatility levels (0, 1, 2, or 3 standard deviations). 🎯
• The trailing stop is continuously adjusted using the typical price (average of High, Low, Close).
Result: Every market moment has its own trailing distance, calculated according to the specific volatility of that context. 🤖
Technical Foundation: Logarithmic Normalized Volatility 🧠
Why a logarithmic transformation? 🤔
Market volatility does not follow a normal (Gaussian) distribution; it tends to have extreme values. The logarithmic transformation:
- Normalizes the distribution: Converts skewed data into a more symmetrical distribution.
- Stabilizes variance: Reduces the impact of extreme volatility spikes.
- Enables statistical comparison: Makes it possible to use standard deviation meaningfully.
Offset Calculation Process 🔢
- Period True Range: Measures the maximum range, considering the High-Low of the period and gaps with the previous close.
- Natural Logarithm: Applies
ln(True Range)to normalize. - Normalization Window: Maintains the last N logarithmic values (normalization period).
- Logarithmic Mean: Average of all
ln(TR)values in the window. - Standard Deviation: Calculates the dispersion of the logarithmic values.
- Volatility Level: Multiplies the deviation by 0, 1, 2, or 3 based on the configuration.
- Final Offset:
Offset = e^(mean + level × deviation)- converts back to the price scale. 💡
How It Works? ⚡
Bidirectional Trailing Mechanics
The system operates in two alternating modes:
BEARISH Mode (Short): 📉
• Trailing stop is placed ABOVE the price.
• It updates downward when the price falls (never rises).
• Reversal signal when the price CLOSES above the trailing stop.
BULLISH Mode (Long): 📈
• Trailing stop is placed BELOW the price.
• It updates upward when the price rises (never falls).
• Reversal signal when the price CLOSES below the trailing stop.
Reversal Signals:
• A circular dot marks the trend change (entry of a new position).
• Green color = New bullish trend (). ✅
• Red color = New bearish trend (). 🔴
Parameters and Impact 🎛️
Calculation Period (10)
- Function: Defines how many bars are used to calculate the True Range.
- ↑ Higher (20-50): Measures longer-term volatility, smoother, less sensitive.
- ↓ Lower (5-8): Measures short-term volatility, more reactive, detects rapid changes.
Normalization Period (100)
- Function: Window of logarithmic values to calculate the mean and standard deviation.
- ↑ Higher (200-500): More stable normalization, gradual changes in offset.
- ↓ Lower (50-80): More reactive normalization, offset adapts faster.
- Critical Impact: This parameter determines how "memorized" the historical volatility context is. 🧠
Volatility Level (Level 2)
- Function: Number of standard deviations applied to the offset calculation.
- Level 0 (0σ): Offset = logarithmic mean = tightest distance, maximum sensitivity. 🎯
- Level 1 (1σ): Offset includes 1 deviation = moderate distance, captures ~68% of variation.
- Level 2 (2σ): Offset includes 2 deviations = wider distance, captures ~95% of variation (balanced). ⚖️
- Level 3 (3σ): Offset includes 3 deviations = very wide distance, captures ~99% of variation, maximum tolerance. 🛡️
___________________________________________________________________________________________________
🚀 10,000+ traders already use our TOP indicators🏆
👉 Get all our TOP systems here:
_______________________________________________
📌 Market Structure Indicators
· ✅ AdvancedMarket Structure: Bos, Choch, SwinLevels, Order Blocks, Market Structure& Liquidity Finder
· 🔄 Dynamic Market StructureAnalysis of Turning Points
· 🧱 Order Block
· ⚖️ Market Imbalance
· ⛓️ BOS & CHOCH
· 🧠 ICT Power of 3
_______________________________________________
🔚 Smart Exit Systems
_______________________________________________
📐 ZigZag Indicators
· 🔍 ZigZag Price LiquidityProjection
· ➖ ZigZag
_______________________________________________
🧱 Support & Resistance Indicators
· 🟩 SmartTrend Support &Resistance Lines
· 🧱 All Support and ResistanceLevels
_______________________________________________
📊 Trend & Channel Indicators
· 📊 Supertrend
_______________________________________________
💧 Volume & Liquidity Tools
_______________________________________________
⚡ Momentum & RSI Indicators
· 🔎 Multi-Level Candle Bias
Tracker
_______________________________________________
🔮 Prediction & Projection Tools
· 📐 Prediction Based on Linreg& ATR
· 📏 Fibonacci Linear RegressionMulti-timeframe
· 📈 Volume-Powered Market Flow Projector_________________________________________________________________________________________________
Summary
The system operates bidirectionally with two modes:
- Bearish (short) mode places the trailing stop above the price, adjusting downward as price falls, signaling a reversal when price closes above the stop.
- Bullish (long) mode places the trailing stop below the price, adjusting upward as price rises, signaling a reversal when price closes below the stop.
Reversal signals are visually marked with colored dots indicating trend changes (green for bullish, red for bearish). Key parameters include the calculation period for True Range, normalization period for volatility data, and volatility level defining the offset distance based on standard deviations.
This indicator supports various markets including Forex, cryptocurrencies, commodities, indices, and stocks, with symbols such as BTCUSD, EURUSD, GBPUSD, XAUUSD, NAS100, and USDJPY. It is designed to provide adaptive trailing stops that respond to real-time volatility, enhancing trade exit strategies.