Pinescriptlabs Store indicators: Pinescriptlabs Store cBots : (cBot) Gold & BTC BreakoutSession Pivots(new)
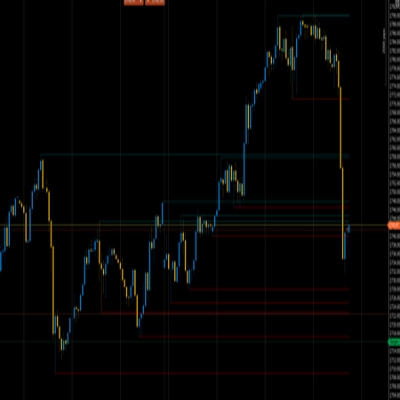
Prediction Based on Linreg & ATR
SmartTrend Support &
Resistance
Lines
Dynamic
Market Structure
Analysis
of
Turning
Points
Fibonacci
Linear
Regression
Multi-timeframe
Auto
Support and
Resistance
Trend
Lines
All
Support and
Resistance
Levels
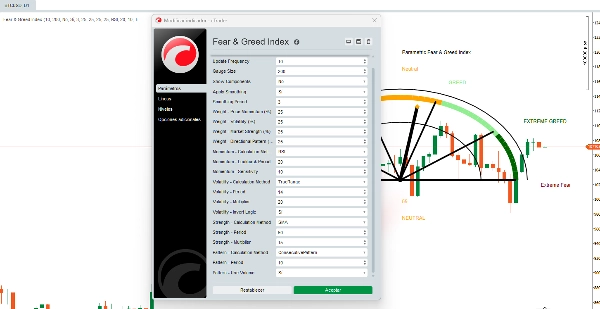
Fear & Greed Index
The Fear & Greed indicator is an advanced visual algorithm that synthesizes market sentiment into a 0-100 value using a semi-circular gauge. Unlike basic versions, this tool is fully customizable, allowing traders to tweak every aspect of its calculation.
📊 The 4 Core Components (Configurable)
1️⃣ Price Momentum *(Configurable Weight: 0-100%)*
6 Calculation Methods Available:
- PriceChange: Simple % change vs. previous period
- ROC: Normalized Rate of Change
- RSI: Modified RSI for momentum
- SMADeviation: Price deviation from SMA
- EMADeviation: Price deviation from EMA
- MACD: MACD signal as momentum indicator
🔧 Customizable Parameters:
- Lookback period *(5-100)*
- Calculation sensitivity *(1.0-50.0)*
2️⃣ Volatility *(Configurable Weight: 0-100%)*
6 Calculation Methods Available:
- TrueRange: Volatility based on True Range
- HighLowRange: Simple High-Low range
- CloseToClose: Logarithmic close-to-close volatility
- ATR: Standard Average True Range
- StandardDev: Price standard deviation
- ParkinsonVol: Parkinson volatility estimator
🔧 Customizable Parameters:
- Calculation period *(5-50)*
- Volatility multiplier *(1.0-100.0)*
- Logic inversion (higher volatility = more fear)
3️⃣ Market Strength *(Configurable Weight: 0-100%)*
6 Calculation Methods Available:
- SMA: Position relative to Simple Moving Average
- EMA: Position relative to Exponential Moving Average
- VWAP: Position relative to Volume Weighted Average Price
- HLBand: Position within High-Low band
- BollingerPos: Position inside Bollinger Bands
- PivotDistance: Distance to pivot points
🔧 Customizable Parameters:
- Calculation period *(10-200)*
- Strength multiplier *(1.0-50.0)*
4️⃣ Directional Pattern *(Configurable Weight: 0-100%)*
6 Calculation Methods Available:
- BullBearRatio: Bullish/Bearish candle ratio
- VolumePattern: Volume trend analysis
- BodySizePattern: Candle body size analysis
- WickPattern: Wick pattern analysis
- GapPattern: Gap detection & analysis
- ConsecutivePattern: Consecutive price movement analysis
🔧 Customizable Parameters:
- Analysis period *(5-30)*
- Volume usage in calculations (optional)
⚙️ Advanced Features
🔹 Flexible Weighting System
- Custom weights per component *(0-100%)*
- Auto-normalization if weights don’t sum to 100%
- Warnings for suboptimal configurations
🔹 Smart Smoothing
- Optional smoothing to reduce noise
- Adjustable smoothing period *(1-10)*
- SMA filter applied to final results
🔹 Fully Customizable Display
- Gauge size *(50-500px)*
- Update frequency *(1-50 bars)*
- Optional component breakdown (shows individual values)
- Auto-adapts to instrument & timeframe
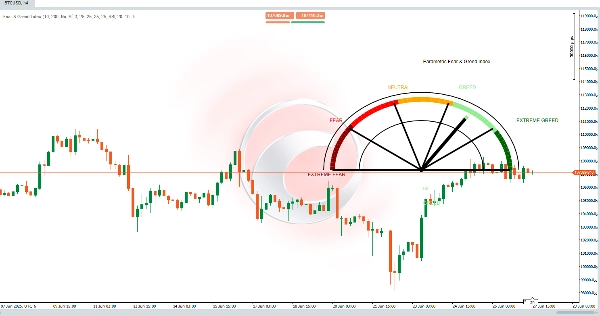
🔄 Algorithm Process
Step 4: Visualization
The semi-circular gauge displays 5 color zones:
- 0-20: Extreme Fear
- 21-40: Fear
- 41-60: Neutral
- 61-80: Greed
- 81-100: Extreme Greed
✅ Fully Customizable System:
🎯 Total Flexibility
- Adapts to any market: Forex, Crypto, Stocks, Commodities
- Timeframe-specific: Different settings for scalping vs. swing trading
- Evolves with the market: Adjust strategies as conditions change
5 | 100 % | |
4 | 0 % | |
3 | 0 % | |
2 | 0 % | |
1 | 0 % |