Description
G.A.S - Smart Entry Zone is a price action indicator for US500 (S&P 500 CFD) that helps
traders identify high-probability entry points around a manually defined price zone.
--- WHAT IT ANALYSES ---
The indicator monitors price behavior around two user-defined horizontal levels - the
upper and lower boundaries of the Smart Entry Zone. It tracks how price approaches,
pierces, and reacts to these levels on a bar-by-bar basis, looking for specific
confirmation patterns before generating a signal.
--- HOW TO INTERPRET SIGNALS AND VISUAL ELEMENTS ---
Zone lines mark the upper and lower boundaries of the entry zone for the selected
trading day. Three signal types are detected:
- Case A - Price wicks through the zone and then closes back outside it. A follow-up
candle closing in the direction of the breakout triggers the signal. One signal
per pierce event (one-shot).
- Case B - Previous bar closed outside the zone, current bar wicks through it and
closes back outside. Confirms a retest of the zone boundary.
- Case C - At the exact opening of the signal time window, price is already positioned
beyond the zone. The first confirming candle in that direction triggers the signal.
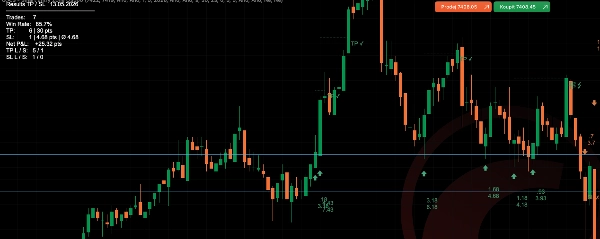
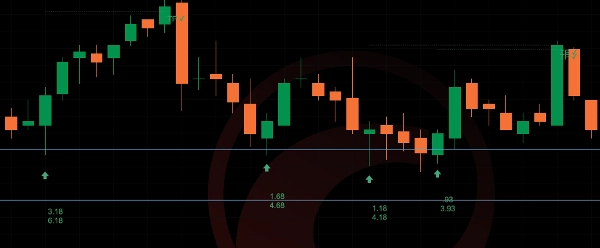
Signals are displayed as arrows below (bullish) or above (bearish) the signal bar.
When TP/SL display is enabled, dotted lines show the take profit and stop loss levels
from the entry bar. A TP or SL label marks the outcome when the level is hit.
The optional SL Distance label shows in real time how far the current price is from
the stop loss zone boundary.
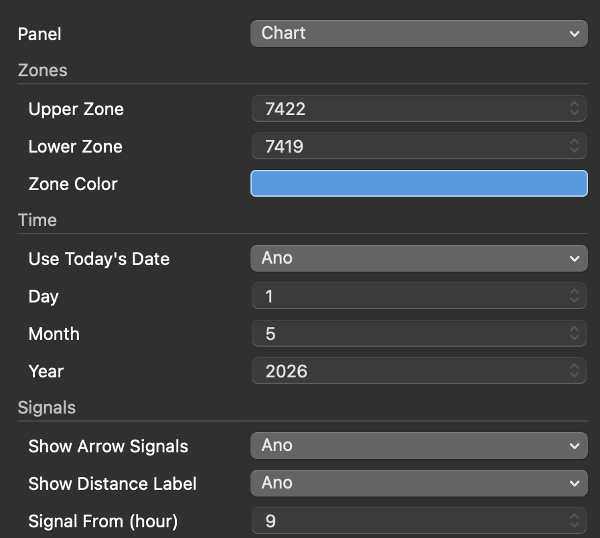
--- KEY SETTINGS AND PARAMETERS ---
- Zones: upper and lower price level, line color, show/hide
- Date: use today's date automatically or set a specific date manually
- Signals: enable arrows, configure time window (e.g. 15:30 / 23:00), pierce lookback
(how many bars after a pierce the signal remains valid), distance labels on/off
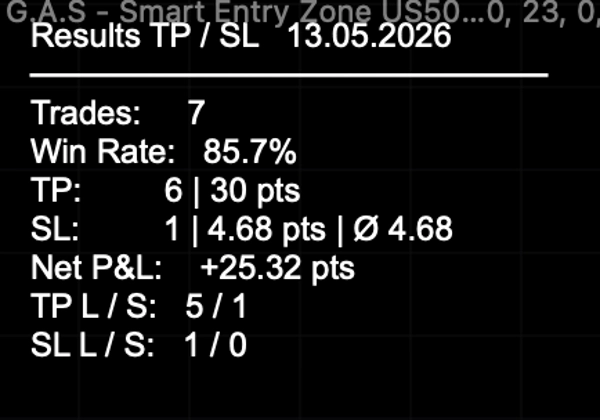
- TP/SL: take profit in points, show lines and labels, results table on/off,
single trade mode (one open trade at a time), custom colors
- SL Distance: enable label, custom color
--- TYPICAL USE CASES AND TRADING SCENARIOS ---
The indicator is designed for intraday trading of US500 on a 5-minute chart. A typical
workflow is: before the US market open, the trader sets the upper and lower zone levels
for the day. Once the signal window opens (default 15:30 Prague / 09:30 New York), the
indicator monitors for Case A, B, or C setups and marks valid entries with arrows.
The TP/SL tracker automatically logs results across the session.
--- WHO THIS INDICATOR IS BEST SUITED FOR ---
Intermediate to advanced traders who already have a defined intraday methodology and
use fixed price zones as part of their decision process. The indicator does not
generate zones automatically - the trader must identify and input the levels manually
each day. It is not suitable for beginners looking for a fully automated signal system.
--- IMPORTANT LIMITATIONS AND USAGE NOTES ---
- Zone levels must be entered manually each trading day- the indicator does not
calculate them automatically.
- Designed and tested for US500 on a 5-minute chart. Behavior on other instruments
or timeframes is not guaranteed.
- Past signal statistics shown in the results table are for reference only and do
not represent a guarantee of future performance.
- The signal time window uses Prague time (CET/CEST) internally. Adjust the
from/to hour settings if your broker uses a different server time.
Summary
Signals appear as arrows indicating bullish or bearish entries, with optional automatic tracking and display of take profit (TP) and stop loss (SL) levels, including real-time SL distance labels. Users can customize zone levels, signal time windows, TP/SL parameters, and visual elements. The indicator logs trade statistics throughout the session for performance reference.
Intended for intermediate to advanced traders who incorporate fixed price zones into their intraday strategies, it requires manual input of zone levels daily and is specifically tailored for the US500 instrument. The indicator does not generate zones automatically and is not designed for other instruments or timeframes. Time settings use Prague time internally and should be adjusted if needed.


