Brokers & props
For business
00
Days
:
00
Hours
:
00
Minutes
:
00
Seconds
Indicator
RSI
Breakout
XAUUSD
Commodities
Supertrend
Crypto
BTCUSD
ZScore Reversion
5.0
03/09/2025
221
Desktop
SinceĀ 03/10/2024
Sales
130
Free installs
25905
"ZScore Reversion" uploaded image"ZScore Reversion" uploaded image"ZScore Reversion" uploaded image

Pinescriptlabs Store indicators:                        šŸ¤–Pinescriptlabs  Store cBots : (cBot)
Gold & BTC BreakoutSession Pivots(new)

Auto-Trend Channel

PREMIUM SSL CHANNEL

ZigZag

 ICT Power of 3 
                                                   

SmartTrend Support &
Resistance
Lines
       

Fair Value Gap Sessions                
       

 BOS & CHOCH

RSI Trend Trigger

Channel Breakout System

Supertrend

Market Imbalance

Adaptive Trend Channel 

Dynamic
Market Structure
Analysis
of
Turning Points

Order Block

Fibonacci
Linear
Regression
Multi-timeframe

Volume POC Heatmap

Dynamic RSI

Momentum Fair Value Gap

Market Flow Projection

Dynamic Trend Gradient

Multi-Level
Candle Bias
Tracker

Zig-Zag Extremity Tracker

Reactive Moving Average

Auto
Support and
Resistance
Trend
Lines

All
Support and
Resistance
Levels

Leverage Liquidation Map

Zones Supply Demand

Dynamic Range Momentum


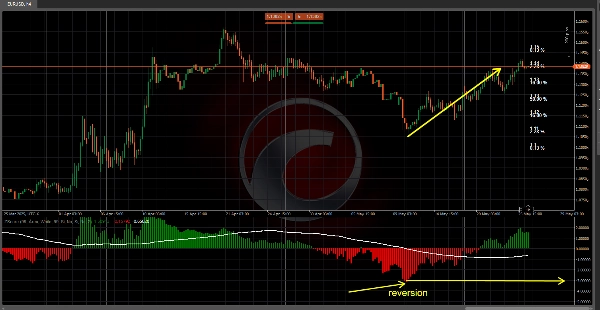
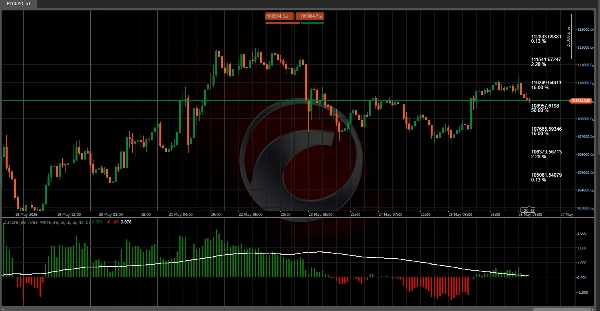
The Z-Score transforms price into a "standard
deviation" scale,
showing how far each candle’s close (or open, high, low) deviates from its
historical mean. With an intuitive visual, it helps identify overbought/oversold
conditions and
high-probability reversal zones! šŸ”„

1ļøāƒ£ What Does It Do?

šŸ”¹ Standardizes Price: Converts the absolute closing value into a Z-Score—how many standard deviations it is from the mean
of the last N bars.
šŸ”¹ Highlights
Statistical Extremes: Values
near Ā±1, ±2, or ±3 indicate rarity in price movement:

  • ±1 SD (ā‰ˆ 68% probability between –1 and 1)
  • ±2 SD (ā‰ˆ 95% probability between –2 and 2)
  • ±3 SD (ā‰ˆ 99.7% probability between –3 and 3)
    šŸ”¹ Aids
    in Mean Reversion Trading:
    When Z-Score exceeds Ā±2 or ±3, the market is in an extreme
    zone and tends to
    revert toward the mean (zero).
    šŸ”¹ Clear
    Visualization: Using histograms (or special candles), a moving average
    line, and colored zones, you can instantly see if price is behaving "normally" or is a statistical
    outlier.

2ļøāƒ£ How Does It Work?

šŸ“ Calculation of Mean & Standard Deviation

  • A lookback
    period (e.g., 99
    bars) is used.
  • The mean and standard
    deviation (SD) of
    closing prices are calculated.
  • Higher SD = More volatility in price movements.

🧮 Z-Score Formula

Z=Current Closeāˆ’Historical MeanStandard DeviationZ=Standard DeviationCurrent Closeāˆ’Historical Mean​

  • Positive Z ā†’ Close above the mean.
  • Negative Z ā†’ Close below the mean.

šŸ“Š Z-Table Probabilities

  • Highlights the
    current Z-Score’s column to show how rare/extreme the price is!

3ļøāƒ£ How to Use It in Trading

āœ… Mean Reversion: Look for Z > +2 or Z < –2 to trade reversals (sell overbought
extremes, buy oversold extremes).
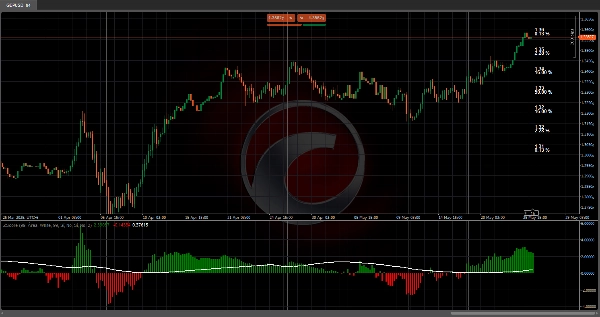
āœ… Trend Confirmation: A sustained Z
> 0 + rising moving average signals
strength; Z < 0 + falling MA suggests weakness.
āœ… Risk Management: Near Ā±1 SD, expect normal moves; near Ā±3
SD, adjust stops &
position sizes carefully.
āœ… Entry Timing: Combine extreme Z-Scores with support/resistance
levels for precise
entries.

4ļøāƒ£ Pros & Considerations

āœ”ļø Advantages

  • Statistical edge in spotting extreme price conditions.
  • Multiple display modes (histogram, candles, bands, probability
    table).
  • Easy customization (length, colors, chart type).

āš ļø Considerations:

  • In strong
    trends, price can stay
    "extreme" for long periods without reversing.
  • Assumes a normal
    distribution—may not
    work well in highly volatile/skewed markets.
  • Best used in stable
    volatility environments.


5.0
Reviews: 1
5
100 %
4
0 %
3
0 %
2
0 %
1
0 %
Customer reviews
May 27, 2025
Good implementation of Z Scores. I found that Z Scores work best when using MTF analysis to show counter trend scalps but I am sure those who trade moving average plays will find this very useful!
More from this author
Indicator
RSI
Breakout
XAUUSD
+6
ZigZag
ZigZag filters noise, spots trends, patterns, pivots, aiding analysis, trade management, and confirmations. šŸ“‰šŸ“ˆ
Indicator
RSI
Breakout
XAUUSD
+6
Order Block
Identify bullish and bearish Order Blocks to spot key support/resistance levels and potential trend reversals! šŸ“ˆšŸ”„
Indicator
RSI
Breakout
XAUUSD
+5
Auto-Trend Channel
Adaptive trend channel using linear regression and Pearson correlation for dynamic support, resistance, and trends.
Indicator
RSI
XAUUSD
Breakout
+5
BOS & CHOCH
Market structural patterns , specifically the concepts of Change of Character (ChoCH) šŸ”„ and Break of Structure (BoS) šŸ’„
Indicator
RSI
Breakout
XAUUSD
+6
Volume POC Heatmap
šŸ“Š Shows volume by price levels, highlights POC, and key zones. Identifies dynamic support/resistance and imbalances.
Indicator
RSI
Breakout
Supertrend
All Support and Resistance Levels
"Identify key market zones and visualize support/resistance from multiple timeframes on a single chart.
Indicator
RSI
Breakout
XAUUSD
+5
Zones Supply Demand
šŸ“ŠZones Supply & Demand: Identifies key price levels with high volume concentration, marking Supply/Demand Zones & Marke
Indicator
RSI
Breakout
XAUUSD
+5
Supertrend
šŸ’¹ Define a price channel šŸ“ˆ and determine trend direction (bullish 🟢 or bearish šŸ”“).
Indicator
RSI
Breakout
XAUUSD
+6
Fair Value Gap Sessions
identify and highlight temporary market inefficiencies known as "fair value gaps" 🚨 within specific trading Sessions.
Indicator
RSI
Breakout
XAUUSD
+4
Dynamic Market Structure Analysis of Turning Points
Identify market structure effortlessly with swing highs, lows, CHoCH, and BOS levels for smart trading decisions! šŸ“ŠšŸ”"
Indicator
Indices
RSI
XAUUSD
+7
RSI Divergence
Detects bullish and bearish divergences
Advanced Market Structure Bos,Choch,SwinLevels, Order Blog
Advanced price action toolĀ that combines multiple technical analysis concepts
Indicator
RSI
Breakout
Supertrend
Swing Levels
šŸ” Automatically detect support and resistance levels based on "swings" or pivots
Indicator
RSI
Breakout
Supertrend
Trend Heikin Multi MA
šŸš€ TrendHeikinMultiMA: Advanced trend detection using Heikin-Ashi smoothing & MAs! Eliminates noise, confirms real trend
Indicator
RSI
Breakout
XAUUSD
+4
Multi-Level Candle Bias Tracker
Price direction by calculating the probability of reaching new highs/lows. Shows levels & statsšŸ“ˆ
Indicator
RSI
Breakout
Supertrend
Leverage Liquidation Map
šŸ“Š Liquidation Map: Potential areas where highly leveraged investors might face liquidations.
Indicator
RSI
XAUUSD
Breakout
+4
ICT Power of 3
šŸŽÆ Auto-plots key zones (Accumulation, Manipulation, Distribution) . Reveals institutional traps & trends.
Indicator
NAS100
NZDUSD
XAUUSD
+9
PineScriptLabs Smart Signals CDRC Auto TPSL
šŸŽÆSmart Signals : Auto Buy/Sell alerts with dynamic TP/SL algorithm. šŸ’”
You may also like
IR Macd on Chart
this indicator show macd on chart.
Indicator
Breakout
Forex
Pivot Point Daily Indicator
Pivot Points Standard — All-in-One Multi-Timeframe Pivot Indicator for cTrader
Indicator
Forex
EURUSD
EconomicForex
ECONOMIC FOREX:provides insights into inflation, nominal interest rates and real interest rates, in the line chart
Indicator
NAS100
NZDUSD
XAUUSD
+12
Cosmic Decision System Pro
Decision System Indicator According to Cosmic Laws
Indicator
Signal
MACD
TradingViewMACD
Enhance your trading strategy with our customizable TradingViewMACD indicator. Optimize and elevate your market analysis
Indicator
XAUUSD
Forex
EURUSD
+2
FX Market Sessions
Visualize trading sessions with high/low levels, customizable colors, and live open session display
Indicator
Grid
NAS100
NZDUSD
+18
Zig Zag ATR
ZigZag Pro — Advanced swing detection with ATR threshold, fractal confirmation, and colored segments. Clean market
Indicator
Indices
Stocks
Commodities
+2
PRC Momentum Hybrid
a visually very powerful tool for analyzing "opposing forces".
Indicator
Indices
Commodities
Forex
LineHelper_Pro
LineHelper is your complete line-drawing assistant for setting up trading zones quickly
Indicator
NAS100
NZDUSD
XAUUSD
+11
[Stellar Strategies] Candlestick Patterns Dashboard
The Candlestick Patterns Dashboard. Detects 30+ patterns with Strength %, Trend Filters, Alerts & Win Rate Stats. šŸ“‰šŸ“ˆ
Indicator
Forex
Signal
Ariaware.003PGap
The Pressure Gap indicator identifies sudden price jumps without using volume.
Indicator
NAS100
NZDUSD
Martingale
+26
Trend & Volume Regime Map
Trend & Volume Regime Map – A normalized price & volume regime map for cTrader that scores trend from –10 to +10, colors
Indicator
NAS100
NZDUSD
XAUUSD
+12
Auto Chart Patterns
šŸŽÆAutomatically detects and visualizes classical chart patterns using multi-timeframe swing point analysis.
[Hamster-Coder] Moving Average
Universal Moving Average indicator with extended features
Indicator
FVG
Fibonacci
Fair Value Gap (Extended)
Detect FVGs with age, status, Fibonacci levels, and customizable fill threshold—extended version.
Indicator
Breakout
Stocks
Signal
Darvas Box
The Darvas Box involves identifying "boxes" or trading ranges where a stock's price consolidates before breaking out.
Indicator
NAS100
XAUUSD
FVG
+11
Fair Value Gaps_FVG_MTF
Multi-TF FVG + Smart Fibonacci
Fibonacci Pitchfan
Powerful all-in-one toolĀ for traders seeking aĀ clear, dynamic viewĀ of market structure. By mergingĀ pivots, trendlines &