
Overview
Swing Flow is an advanced trend-following indicator that displays directly on the price chart, giving you a clean, intuitive visual signal — similar in style to the classic SuperTrend — but powered by a fundamentally different and more sophisticated underlying logic.
Where standard trend indicators react to every candle, Swing Flow anchors its calculations to significant market swing points, producing a line that truly reflects the dominant trend with far less noise and false signals.
How It Works (Without Revealing the Formula)
Swing Flow identifies meaningful pivot highs and pivot lows in the market — the natural turning points where price has actually reversed. It then builds a dynamic mid-level and two adaptive bands (upper and lower) around those pivots, applying volatility-adjusted smoothing to filter out short-term fluctuations.
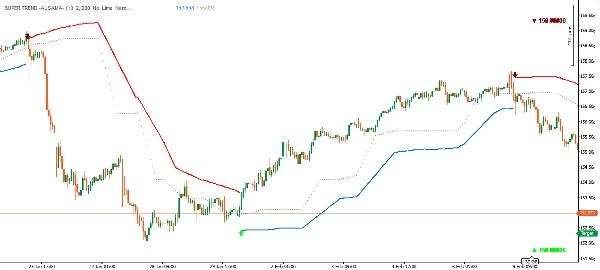
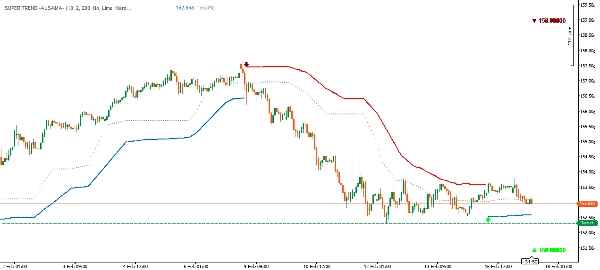
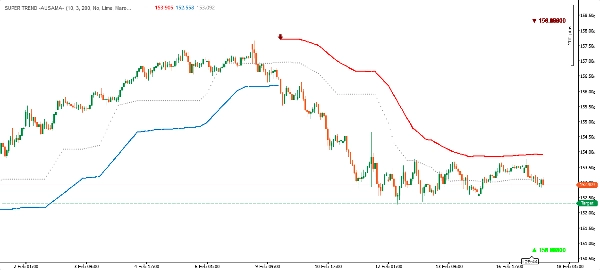
The result is a single trend line displayed on the chart:
- 🟢 Green line below price → Bullish trend (acts as dynamic support)
- 🔴 Red line above price → Bearish trend (acts as dynamic resistance)
When the trend flips, the line switches sides and color — exactly like SuperTrend — making it immediately obvious and actionable.
Indicator Components
ComponentDescription
Main Trend Line
The primary signal line — green below price in uptrend, red above in downtrend
Upper Band
Dynamic resistance level, shown during bearish phases
Lower Band
Dynamic support level, shown during bullish phases
Mid Line
The adaptive centerline derived from market structure
Signal Markers
Up/Down arrows with price labels at every trend reversal
Pivot Labels (optional)
Diamond markers at swing highs and lows (can be toggled on/off)
Key Advantages
✅ Structure-Based Logic
Unlike most trend indicators that only look at recent price action, Swing Flow is built on actual swing pivot points — the levels the market itself has already validated as significant. This makes the trend signal fundamentally more meaningful.
✅ Adaptive Volatility Filter
The bands automatically adjust to current market volatility, tightening in calm conditions and widening during volatile periods. This reduces whipsaws without requiring manual tuning.
✅ Clean SuperTrend-Style Display
Despite its advanced logic, the visual output is clean and familiar. One line on the chart — green below, red above. No clutter. Immediately readable on any timeframe.
✅ Precise Entry Signals
Every trend change is marked with a directional arrow and the exact closing price at the reversal bar, giving you a clear reference point for entries.
✅ Full Color Customization
Both bull and bear colors are fully customizable to match your chart style or personal preference.
✅ Works on All Markets & Timeframes
Forex, indices, commodities, crypto — the indicator adapts naturally to any instrument and timeframe thanks to its volatility-aware design.
How to Use
Trend Following: Follow the trend in the direction of the line — buy when the line is green (below price), sell or stay out when the line is red (above price).
Dynamic Support & Resistance: The active band serves as a real-time support (bullish) or resistance (bearish) level. Price returning to the line without breaking it is a continuation signal.
Entry Signals: The arrow markers (▲ / ▼) indicate a confirmed trend change. These can be used as entry triggers, especially when aligned with other confluences on your chart.
Pivot Reference (optional): Enable "High & Lows" to display the swing pivot points the indicator uses internally. Useful for understanding market structure at a glance.
Swing Flow vs. Standard SuperTrend
FeatureStandard SuperTrendSwing Flow
Calculation basis
Every single candle
Validated market swing pivots
Signal noise
Higher — reacts to each bar
Lower — anchored to structure
False signals
More common in choppy markets
Significantly reduced
Adaptability
Fixed ATR multiplier
Volatility-smoothed bands
Visual style
Single line
Single line + bands + mid-level
Entry confirmation
Color change
Arrow + price label at reversal
Pivot visibility
None
Optional pivot markers
In short: Swing Flow looks like SuperTrend, but thinks like a price action trader.
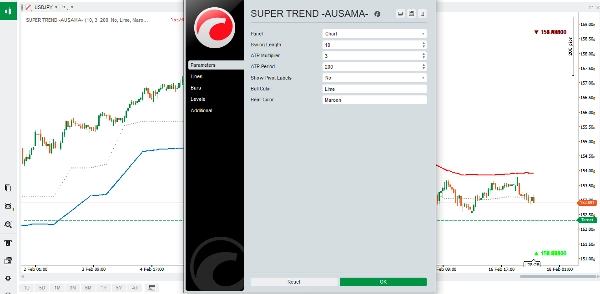
Input Parameters
ParameterDefaultDescription
Swing Length
10
Controls pivot detection sensitivity
ATR Multiplier
2.0
Band width relative to volatility
ATR Period
200
Lookback for volatility measurement
Show Pivot Labels
Off
Toggle swing high/low markers on chart
Bull Color
Lime
Color for bullish trend
Bear Color
Maroon
Color for bearish trend
Tips for Best Results
- Lower Swing Length (5–8): More sensitive, more signals — suits scalping or active trading.
- Higher Swing Length (14–20): Fewer, higher-quality signals — suits swing trading or position trading.
- Increase ATR Multiplier in highly volatile markets (e.g., crypto) to avoid false flips.
- Decrease ATR Multiplier in stable, trending markets for tighter signals.
- Best used with trend confirmation from higher timeframes.
Swing Flow — Where market structure meets trend clarity.


