Indicator
breakout
supertrend
rsi
"TrendMaster Pro MultiMA" logo
TrendMaster Pro MultiMA
5.0
03/09/2025
278
Desktop

📈 Trend Master Pro MultiMA – The Ultimate Trend Detection Tool 🚀

This indicator plots 20 moving averages with different periods (5, 10, 15, 20, 25, 30, 35, 40, 45, 50, 55, 60, 65, 70, 75, 80, 85, 90, 95, and 100). For each one:

1️⃣ 📊 Select Your Calculation Type: Choose between SMA, EMA, RMA, WMA, or VWMA based on your preference. Optionally, you can enable linear regression smoothing to reduce noise and get a clearer trend.

2️⃣ 📏 Define the Reference Channel: A price range-based channel is calculated using the last 200 candles. The channel width is adjustable, expanding with higher price volatility and contracting in calmer markets.

3️⃣ 📈 Compare Moving Averages with the Channel: Each moving average is analyzed in relation to the channel’s height and its own highs & lows over a defined period (default: 20 candles).

  • 📊 If the difference between the highest and lowest value of the moving average exceeds the channel width, it signals a strong trend (bullish or bearish).
  • ⚖️ If the difference is within or close to the channel, the market is considered neutral or ranging.

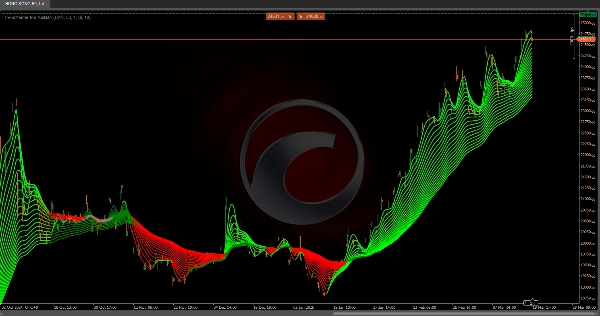
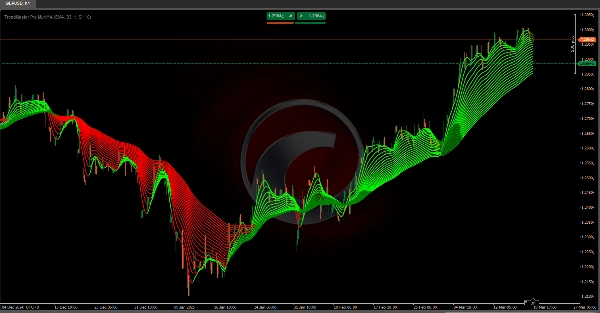
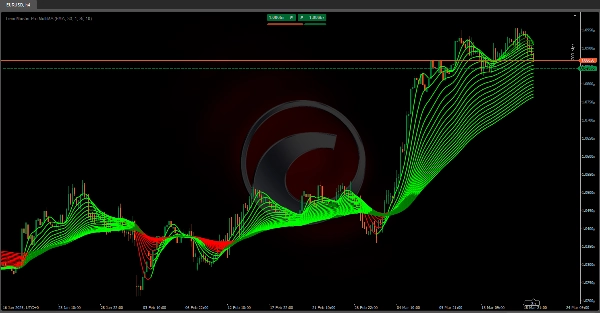
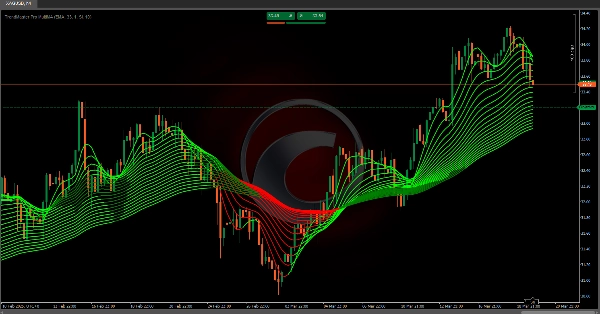
4️⃣ 🎨 Trend-Based Coloring System: Each segment of the moving averages is colored according to trend strength and direction:

  • 🟢 Green = Bullish trend detected
  • 🔴 Red = Bearish trend detected


5️⃣ 📉 Visualizing the Trend: The indicator connects each moving average value from candle to candle, forming a fan-like structure of trendlines. Each moving average dynamically adjusts its color based on the calculated trend.

Why Use Trend Master Pro MultiMA?

This multi-timeframe adaptive approach—combining multiple moving averages, price channels, and regression smoothing—helps quickly identify market phases:
🔹 Bullish trends
🔹 Bearish trends
🔹 Ranging/sideways movements 🔄

🚀 Perfect for traders seeking clear visual insights to make better decisions in short, medium, and long-term timeframes! 📊🔥


Ctrader Store indicators:


Channel Breakout System

Fair Value Gap Sessions

 BOS & CHOCH

ZigZag

Supertrend

Market Imbalance

Adaptive Trend Channel 

Dynamic Market Structure
Analysis of Turning Points

Order Block

Fibonacci Linear
Regression Multi-timeframe

Volume POC Heatmap

Dynamic RSI

Momentum Fair Value Gap

Market Flow Projection

Dynamic Trend Gradient

Multi-Level Candle Bias
Tracker

Zig-Zag Extremity Tracker

Reactive Moving Average

Auto-Trend Channel

Auto Support and
Resistance Trend Lines

All Support and
Resistance Levels

Leverage Liquidation Map

Zones Supply Demand

Dynamic Range Momentum

More from this author
Indicator
breakout
btcusd
supertrend
+6
ZigZag
ZigZag filters noise, spots trends, patterns, pivots, aiding analysis, trade management, and confirmations. 📉📈
Indicator
breakout
btcusd
supertrend
+6
Order Block
Identify bullish and bearish Order Blocks to spot key support/resistance levels and potential trend reversals! 📈🔄
Indicator
breakout
btcusd
supertrend
+5
Auto-Trend Channel
Adaptive trend channel using linear regression and Pearson correlation for dynamic support, resistance, and trends.
Indicator
breakout
btcusd
supertrend
+5
BOS & CHOCH
Market structural patterns , specifically the concepts of Change of Character (ChoCH) 🔄 and Break of Structure (BoS) 💥
Indicator
breakout
btcusd
supertrend
+5
Zones Supply Demand
📊Zones Supply & Demand: Identifies key price levels with high volume concentration, marking Supply/Demand Zones & Marke
Indicator
breakout
btcusd
supertrend
+5
Supertrend
💹 Define a price channel 📈 and determine trend direction (bullish 🟢 or bearish 🔴).
Indicator
breakout
btcusd
supertrend
+6
Volume POC Heatmap
📊 Shows volume by price levels, highlights POC, and key zones. Identifies dynamic support/resistance and imbalances.
Indicator
breakout
supertrend
rsi
All Support and Resistance Levels
"Identify key market zones and visualize support/resistance from multiple timeframes on a single chart.
Indicator
breakout
btcusd
supertrend
+6
Fair Value Gap Sessions
identify and highlight temporary market inefficiencies known as "fair value gaps" 🚨 within specific trading Sessions.
Indicator
breakout
btcusd
supertrend
+4
Dynamic Market Structure Analysis of Turning Points
Identify market structure effortlessly with swing highs, lows, CHoCH, and BOS levels for smart trading decisions! 📊🔍"
Indicator
breakout
indices
btcusd
+7
RSI Divergence
Detects bullish and bearish divergences
Indicator
breakout
supertrend
rsi
Trend Heikin Multi MA
🚀 TrendHeikinMultiMA: Advanced trend detection using Heikin-Ashi smoothing & MAs! Eliminates noise, confirms real trend
Indicator
breakout
btcusd
supertrend
+4
Multi-Level Candle Bias Tracker
Price direction by calculating the probability of reaching new highs/lows. Shows levels & stats📈
Indicator
breakout
supertrend
rsi
Leverage Liquidation Map
📊 Liquidation Map: Potential areas where highly leveraged investors might face liquidations.
Indicator
breakout
supertrend
rsi
Market Trend OB
Price action to detect when the market changes trend (MSB) and defines, order blocks , ZigZag etc.📊
Indicator
breakout
supertrend
rsi
Zig-Zag Extremity Tracker
Dynamically adjusts regression channels based on ZigZag extremes, resetting when price breaks bands to track real trends
Indicator
breakout
bollinger
supertrend
+3
Fibonacci Linear Regression Multi-timeframe
Combining Fibonacci levels and regression to analyze multidimensional market trends across multiple timeframes¡
Advanced Market Structure Bos,Choch,SwinLevels, Order Blog
Advanced price action tool that combines multiple technical analysis concepts
You may also like
[Hamster-Coder] Pivot Points (Demo)
[Hamster-Coder] Pivot Points (Demo)
IR Coral
Coral indicator
Hull Moving Average Colored
The traditional Hull Moving Average with different colours based on the slope (direction) of the trend.
ZigZagSmartAlert
ZigZag Smart Alert for cTrader Description: ZigZag Smart Alert is a next-generation swing indicator for cTrader, designe
Open Trade PipsV1
This indicator tracks the unrealised amount of pips in your open positions.
Goldenhours
The Session Golden Hours indicator is designed for serious traders looking to visualize high-probability
Indicator
forex
indices
rsi
+1
FiboTrend-Pro
😎Read the description before purchasing💩
Trinity StochX
Indicator Stochastic With RSI
Indicator
forex
indices
usdjpy
JPYX w HMA
JPYX Indicator with HMA
[Hamster-Coder] Moving Average MTF
Universal multi time frame 'Moving Average' indicator with extended features
Price Speed or Acceleration v1
This Indicator will display either the speed or the acceleration of the current symbol.
Indicator
signal
Half Trend BT
Half Trend BT by BullittTraders
Zero Lag MACD
Zero Lag MACD delivers ultra-responsive trend and divergence signals with minimal lag, empowering timely Forex entries.
Indicator
forex
prop
commodities
+2
Light-Version BrickAlgo TrendPulse
🚀 Simplify Your Trading Decisions With Powerful Technical Analysis.
EURUSD Breakout Indicator
Breakout Multi-Timeframe Strategy Indicator
Market Sessions - Free
Track major trading sessions (Tokyo, London, New York) with customizable colors and visual sessions on your chart.
Indicator
bollinger
RT Qualitative Quantity Estimation
Unlock trading precision with QQE! Dual QQE indicators with a Bollinger Bands zero line provide clear buy/sell signals.
Break of Structure
The Break of Structure (BoSCHoCh) Indicator is a smart market structure tool designed to help traders easily spot trend.