
Squeeze Momentum Indicator 2.0version
Indicator
54 downloads
Version 1.0, Nov 2025
Windows, Mac
Description
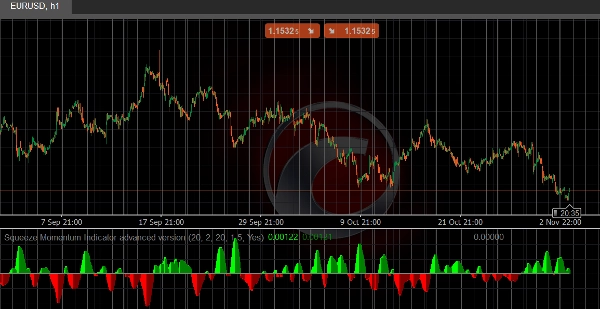
This cTrader indicator implements the popular Squeeze Momentum strategy, designed to identify low-volatility consolidation periods and potential breakout opportunities.
How It Works:
- Compares Bollinger Bands against Keltner Channels to detect volatility "squeeze" conditions
- Measures momentum strength using linear regression calculations
- Provides clear visual signals through color-coded histograms and dynamic zero lines
Key Features:
🎯 Squeeze Detection - Identifies when Bollinger Bands move inside Keltner Channels (squeeze) and when they expand (breakout)
📊 Momentum Measurement - Histogram displays current momentum strength and direction
🎨 Visual Signals:
- Lime/Green bars: Bullish momentum (strengthening/weakening)
- Red/Maroon bars: Bearish momentum (strengthening/weakening)
- Blue/Black/Gray zero line: No squeeze/Squeeze active/Squeeze releasing
Customizable Parameters:
- BB Length & Multiplier
- KC Length & Multiplier
- TrueRange option for Keltner Channel calculation
Perfect For:
- Spotting consolidation breakouts
- Timing entries during low volatility periods
- Confirming momentum direction
- Swing trading and position trading
Summary
Indicator profile
Customer reviews
0.0
Reviews: 0
Customer reviews
No reviews for this product yet. Already tried it? Be the first to tell others!
Discussion
FAQ
Prop
Forex
Breakout
Indices
Commodities
Crypto
Stocks
Bollinger
Products available through cTrader Store, including trading bots, indicators and plugins, are provided by third-party developers and made available for informational and technical access purposes only. cTrader Store is not a broker and does not provide investment advice, personal recommendations or any guarantee of future performance.


Price
10M
Traded volume
10.64K
Pips won
23
Sales
1.23K
Free installs