
BullMoonPerformance
指标
61 下载
版本 1.0, Feb 2026
Windows 版、Mac 版
5.0
评价:1
说明
产品描述:BullMoon性能面板
该BullMoon性能面板是一个强大的cTrader分析工具,旨在帮助交易者实时监控其表现,并直接在图表上直观地重建过去的交易。
1. 市场数据和条件
该面板分析您的账户相关交易数据和所选符号的历史价格数据。
- 它评估已平仓和持仓交易,以计算关键指标,如净利润、回撤和胜率。
- 该指标扫描您的历史记录,精确定位进出场点位。
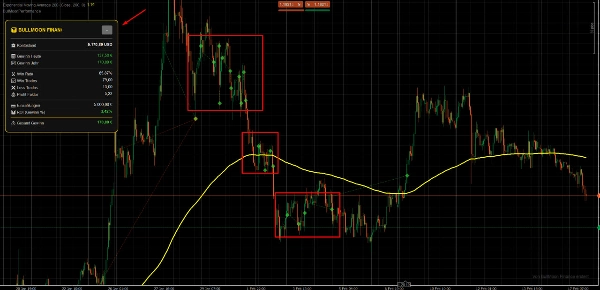
2. 信号和视觉元素的解释
为了使分析尽可能直观,该工具在图表上使用清晰的视觉标记:
- 符号: 进出场用特定符号标记(例如箭头或点),让您立即看到仓位的开仓和平仓位置。
- 视觉线条: 连接这些符号的线条展示交易持续时间,使盈利或亏损阶段直观可见。
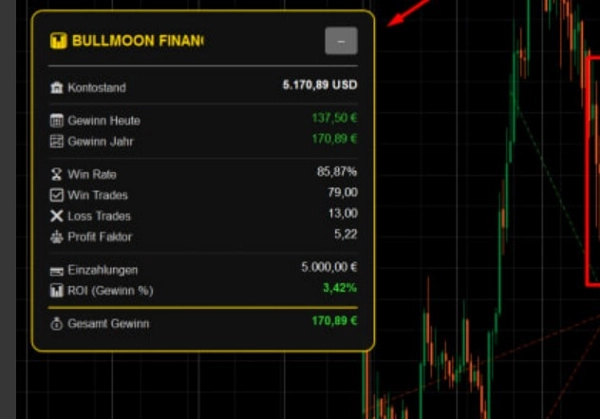
- 仪表盘: 一个紧凑的屏幕仪表盘提供硬数据,包括美元利润、交易总手数和R因子。
3. 关键设置和参数
您可以根据您的具体交易风格自定义面板:
- 历史周期: 定义图表上应显示多少天的过去交易。
- 视觉效果: 盈利和亏损交易的颜色,以及线条和符号的透明度,均可完全调整。
- 计算基础: 为统计输出设置固定手数或基于百分比的风险。
4. 典型用例和交易场景
- 交易后分析: 回顾您的交易日,确保您正确遵循了策略。
- 策略优化: 直观识别您的止盈或止损水平是否持续设置得过紧或过宽。
- 实时监控: 跟踪您当前的每日表现,无需来回切换到账户历史标签页。
5. 目标受众(账户规模和经验)
- 经验水平: 适合希望更好感知其交易的初学者,以及需要快速视觉表现检查的专业人士。
- 账户规模: 适用于任何账户规模。对于同时运行多种策略且需要保持清晰概览的交易者尤其有价值。
6. 重要限制和使用说明
- 平台: 专为cTrader开发。
- 数据可用性: 历史交易的显示取决于您的cTrader账户历史中数据的可用性。
- 非信号生成器: 请注意,该面板是一个分析工具,不生成独立的买入或卖出信号。
摘要
AI 摘要
BullMoon Performance Panel is an analytical indicator designed for the cTrader platform that visually reconstructs and monitors trading performance directly on the chart. It analyzes account-related trading data alongside historical price data of the selected symbol, evaluating both closed and open trades to calculate metrics such as net profit, drawdown, and win rate. Entry and exit points are precisely identified and marked with symbols like arrows or dots, connected by lines that illustrate trade duration and profit or loss phases.
The panel features a compact dashboard displaying key statistics including profit in USD, total lots traded, and the R-factor. Users can customize the display period for historical trades, adjust colors and transparency of visual elements, and set calculation parameters based on fixed lot sizes or percentage risk.
Typical use cases include post-trade analysis, strategy optimization by evaluating take profit and stop loss settings, and live monitoring of daily performance without switching views. The tool supports various markets and symbols such as Forex (EURUSD, GBPUSD, USDJPY), Indices (NAS100), Commodities (XAUUSD), Crypto (BTCUSD), and Stocks. It is suitable for traders of all experience levels and account sizes, especially those managing multiple strategies simultaneously. The panel is strictly an analytical tool and does not generate trade signals.
指标配置
客户评价
5.0
评价:1
5 | 100 % | |
4 | 0 % | |
3 | 0 % | |
2 | 0 % | |
1 | 0 % |
客户评价
March 5, 2026
BullMoonPerformance is a practical trading analytics panel that reconstructs your trades directly on the chart. Entries, exits and trade duration become instantly visible, making post-trade analysis much easier. The dashboard shows key performance metrics such as profit, lots and R-factor. A useful tool for reviewing strategy execution and understanding trading behavior. Ideal for traders who want to learn from their own history.
讨论
常见问答
BTCUSD
Forex
Indices
EURUSD
Commodities
GBPUSD
NZDUSD
Prop
Crypto
Stocks
XAUUSD
NAS100
USDJPY
cTrader Store 提供的所有产品,包括交易机器人、指标和插件,均由第三方开发者提供,仅供信息参考和技术访问之用。cTrader Store 并非经纪商,不提供投资建议、个人推荐或任何未来业绩保证。
该作者的其他作品
猜您喜欢


价格
注册日期 09/01/2026
834.97M
交易量
520.52K
盈利点数
61
免费安装