
Description
- What it does (its value).
- How it helps traders.
- What makes it unique.
- How to use it (brief).
- What the paid version will unlock (tease).
🔸
Session Golden Hours Indicator
(Free Version)
Description
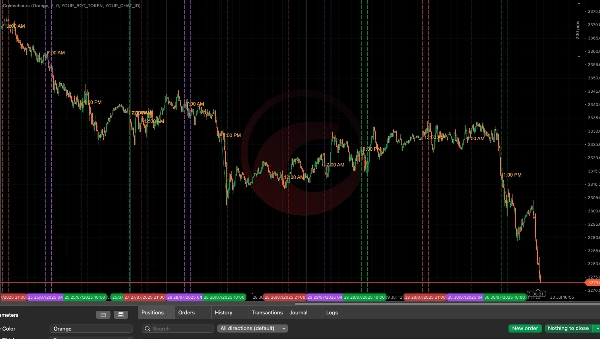
The Session Golden Hours indicator is designed for serious traders looking to visualize high-probability trading windows based on session-based liquidity patterns. This tool automatically highlights key time periods across the Asia, London, and New York sessions — often referred to as the market’s “golden hours” — when price is most likely to break from range and reveal institutional intent.
What It Does:
- Tracks Asia session highs/lows (00:00–08:00 UTC) to map liquidity zones.
- Highlights London and New York key hours such as:
- London Pre-Close (06:00–07:00 UTC)
- London Close Hour (07:00–08:00 UTC)
- NY Afternoon Sweep Zone (13:00–14:00 UTC)
- Draws visual guides on your chart to anchor your awareness around daily breakout hours.
How This Helps You:
- Easily spot liquidity sweep zones during session overlaps.
- Focus your trading decisions around smart money timeframes — no more trading in dead zones.
- Visually recognize where fake-outs and reversals tend to occur.
- Works across any instrument and any timeframe that follows global session cycles.
Key Features:
- Adjustable line color, thickness, and time extensions.
- Automatic session tracking with zero manual plotting.
- Built-in support for 15 recent trading days.
- Clean, non-intrusive chart visuals.
Great For:
- ICT-style traders (liquidity + timing models)
- Price action scalpers
- Traders who use time-based confluences
🔓 Want More?
The Pro Version (Coming Soon) adds:
- Real-time breakout alerts sent directly to Telegram
- Logic for Asia fake-outs → London reversals and London highs/lows → NY reversals
- Smart cooldown timer to avoid over-alerting
- Full tracking of session-based highs/lows with signal labeling
- Future roadmap: FVG alerts, internal liquidity zones, and signal filtering
Summary
Indicator profile
Customer reviews
4.0
Reviews: 1
5 | 0 % | |
4 | 100 % | |
3 | 0 % | |
2 | 0 % | |
1 | 0 % |
Discussion
FAQ
Products available through cTrader Store, including trading bots, indicators and plugins, are provided by third-party developers and made available for informational and technical access purposes only. cTrader Store is not a broker and does not provide investment advice, personal recommendations or any guarantee of future performance.


Price
3
Free installs