
PDHL
อินดิเคเตอร์
1.84K ดาวน์โหลด
เวอร์ชัน 1.0, Sep 2024
Windows, Mac
2.5
รีวิว: 2
คำอธิบาย
แนะนำตัวบ่งชี้การซื้อขายสูง-ต่ำ
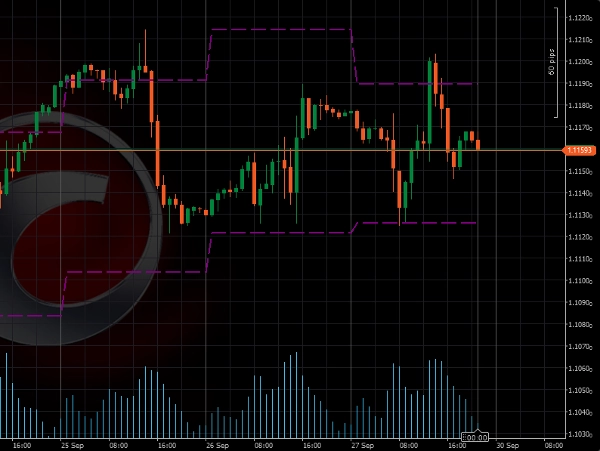
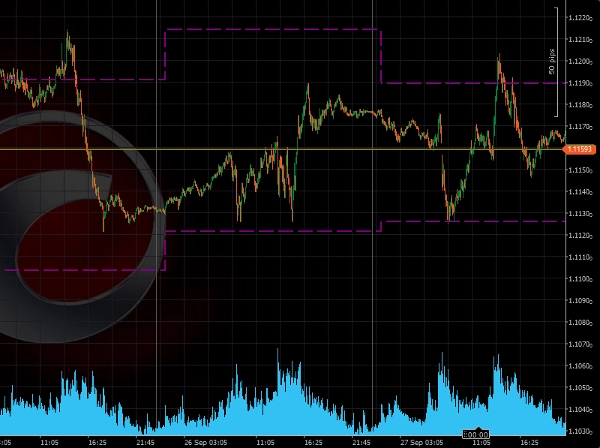
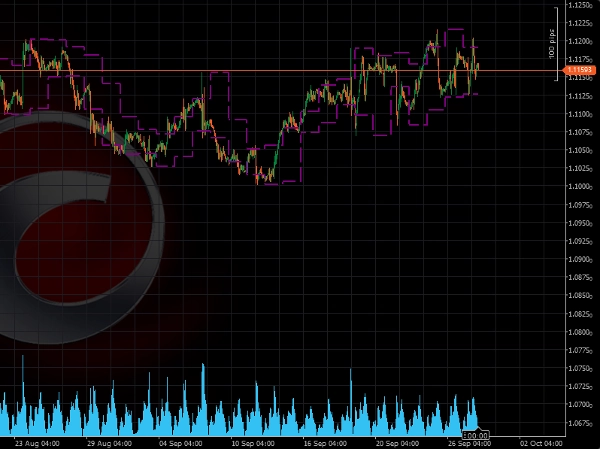
ตัวบ่งชี้นี้ถูกออกแบบมาเพื่อวางระดับราคาสูงสุดและต่ำสุดของวันก่อนหน้าโดยอัตโนมัติบนแผนภูมิของคุณ เครื่องมือนี้ช่วยให้คุณระบุระดับสำคัญสำหรับการเบรคเอาท์และการกลับตัวได้อย่างรวดเร็ว
ประโยชน์หลัก:
- เหมาะสำหรับการซื้อขายเบรคเอาท์: ตัวบ่งชี้นี้เน้นระดับราคาสำคัญจากวันก่อนหน้า ซึ่งมักใช้เป็นจุดอ้างอิงสำหรับกลยุทธ์เบรคเอาท์ การซื้อขายเบรคเอาท์เหนือหรือต่ำกว่าระดับเหล่านี้สามารถให้โอกาสการตั้งค่าที่มีศักยภาพสูง
- เรียบง่ายแต่มีประสิทธิภาพ: ตัวบ่งชี้การซื้อขายสูง-ต่ำมุ่งเน้นไปที่หนึ่งในแง่มุมที่สำคัญที่สุดของการเคลื่อนไหวของราคา – ราคาสูงและต่ำของวันก่อนหน้า โดยการรวมระดับเหล่านี้เข้ากับกลยุทธ์ของคุณ คุณจะได้รับความเข้าใจที่ชัดเจนขึ้นเกี่ยวกับโครงสร้างตลาดและจุดเปลี่ยนแปลงที่เป็นไปได้
ข้อควรระวัง:
- เหมาะสำหรับใช้ในกรอบเวลาที่น้อยกว่า 1 วัน
การตั้งค่า:
- รวมวันอาทิตย์: ค่าเริ่มต้น = ไม่
สรุป
สรุปโดย AI
The PDHL (Previous Day High & Low) indicator automatically plots the prior day's highest and lowest price levels on trading charts. It is designed to assist traders in identifying key price levels that may signal potential breakouts or reversals. By highlighting these critical levels, the indicator supports breakout trading strategies, providing reference points for entering trades when price moves above or below the previous day's range. The tool emphasizes simplicity and effectiveness by focusing on essential price action elements, helping traders better understand market structure and potential turning points. It is best used on intraday timeframes shorter than one day. A configurable setting allows users to include or exclude Sunday in the calculation, with the default setting excluding it.
โปรไฟล์อินดิเคเตอร์
รีวิวจากลูกค้า
2.5
รีวิว: 2
5 | 0 % | |
4 | 0 % | |
3 | 50 % | |
2 | 50 % | |
1 | 0 % |
รีวิวจากลูกค้า
October 9, 2025
What Timezone is it in at default? It seems to fail to get the accurate Highs and lOws for different istruments. You could add that as a customisable input. Please add closing price too
July 9, 2025
Pros: Simple and clear display of previous day's high/low levels. Stable performance. Easy to use and customize. Cons: No breakout alerts. No visual zone fill option. Lacks additional filters or Fibo levels.
การสนทนา
คำถามที่พบบ่อย
Breakout
ผลิตภัณฑ์ที่มีให้บริการผ่าน cTrader Store รวมถึงบอทการเทรด อินดิเคเตอร์ และปลั๊กอิน มีให้บริการโดยนักพัฒนาบุคคลที่สามและมีไว้เพื่อวัตถุประสงค์ในการเข้าถึงข้อมูลและทางเทคนิคเท่านั้น cTrader Store ไม่ใช่โบรกเกอร์และไม่ได้ให้คำแนะนำการลงทุน คำแนะนำส่วนบุคคล หรือการรับประกันผลการดำเนินงานในอนาคต
เพิ่มเติมจากผู้เขียนคนนี้


ราคา
ตั้งแต่ 24/09/2024
4.46K
ติดตั้งฟรี