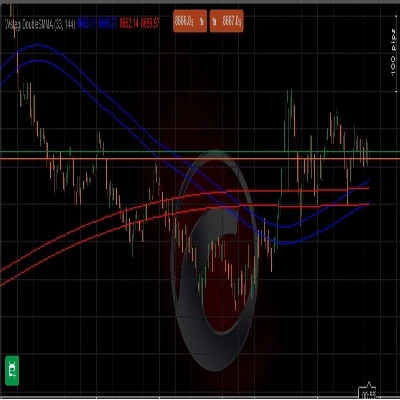
โบรกเกอร์และ Props
สำหรับธุรกิจ
00
Days
:
00
Hours
:
00
Minutes
:
00
Seconds
smma tel
"smma tel" โลโก้
ตั้งแต่ 16/05/2025
ติดตั้งฟรี
64

Wstegi HTS 33 144

0.0
รีวิว: 0
รีวิวจากลูกค้า
ยังไม่มีรีวิวสำหรับผลิตภัณฑ์นี้ หากเคยลองแล้ว ขอเชิญมาเป็นคนแรกที่บอกคนอื่น!
เพิ่มเติมจากผู้เขียนคนนี้
นอกจากนี้คุณยังอาจชอบ
Trailing Smart Algorithm
Trailing algo 📈 auto-tracks trends 🎯 adapts to volatility 🌟 precise moves 🛡️ retest signals 🚀 no lag, smart market
MTF Candles
Multi Timeframe Candle drawing. Draw Any candles from any timeframe on your chart :-)
Matrix Pro by PrimeQuant
Multi-timeframe S/R, SRWMA trend & Demarker pivots with smart alerts—clarity for any market, any timeframe.
Ctreder Smart SMA Indicator
cTreder Smart SMA
4 RCS Relative Strength w Alerts_NSC
Forex Strength Meter for cTrader: 4 custom currencies, cross alerts, visual arrows. Trade smarter!
8 Currencies_NSC
RCS: 8 majors! AUD,USD,EUR,JPY,GBP,CAD,CHF,NZD. Find how strong each currency is relatively and trade smarter!
SuperTrend from TradingView
Get the exact SuperTrend experience from TV, now perfectly rebuilt for cTrader
VMM Average Median
VMM Average Median - Advanced Median Indicator with Smart Trend Detection
ยอดนิยม
$ 15
อินดิเคเตอร์
Indices
Commodities
Stocks
+4
LT_Ind_Candles
Most used candle patterns. (1 candle, 2 candles and 3 candles patterns) and Marubozu. Bonus Fibo Risk control.
SupertrendChannels
Supertrend-based channel for entries, trailing stops, and dynamic support/resistance zones.
LIQUIDITY POOLS SIGNAL FREE
INDICATOR,LIQUIDITY POOLS,ACCURATE SIGNAL, NO DELAY,80% PROBABILITY
R S
This indicator is a simple, single-timeframe tool for showing candle sentiment directly on your chart. If you want a mor
IR Close MTF
this indicator show other time frame close in lower time frame. for ex: show daily close in m 15.
New Way Sar - Free
The Parabolic SAR, or "Stop and Reverse," is a dynamic technical analysis tool
CandleColourFlow_MultiFx
CandleColourFlow MultiFx - optimized to work on Fx Majors, Fx MInors, Fx Crosses
Volume Efficiency Analyzer
Analyzes volume efficiency and market quality. Measures effort vs result to identify decisive or exhausted moves.
RSI T3 overbought and oversold area
E7 Correlation Dashboard
E7 Correlation Dashboard.