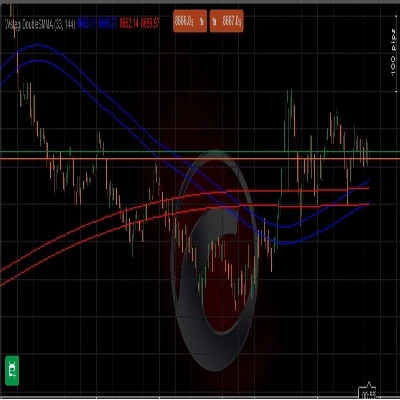
Wstęgi DoubleSMMA
Chỉ báo
71 lượt tải
Phiên bản 1.0, May 2025
Windows, Mac
Mô tả
Băng HTS SMMA 33 144
Tóm tắt
Tóm tắt AI
Wstęgi DoubleSMMA is a trading indicator featuring HTS SMMA bands with periods of 33 and 144. It is designed to be applied on price charts to assist traders in analyzing market trends and potential support or resistance levels. The indicator uses Smoothed Moving Averages (SMMA) to generate bands that reflect price volatility and trend direction over two different timeframes. This dual-period approach aims to provide a clearer view of market dynamics by combining short- and long-term smoothing. The product is suitable for integration into various trading platforms that support custom indicators.
Hồ sơ chỉ báo
Đánh giá của khách hàng
0.0
Đánh giá: 0
Đánh giá của khách hàng
Sản phẩm này chưa có đánh giá nào. Bạn đã dùng thử chưa? Hãy là người đầu tiên chia sẻ với mọi người!
Thảo luận
Câu hỏi thường gặp
Các sản phẩm có sẵn trên cTrader Store, bao gồm bot giao dịch, chỉ báo và plugin, được cung cấp bởi các nhà phát triển bên thứ ba và chỉ nhằm mục đích cung cấp thông tin và tiếp cận kỹ thuật. cTrader Store không phải là nhà môi giới và không cung cấp lời khuyên đầu tư, khuyến nghị cá nhân hay bất kỳ đảm bảo nào về hiệu suất trong tương lai.
Sản phẩm khác của tác giả này


Giá
Kể từ 16/05/2025
139
Cài đặt miễn phí