
3 Bar Triangle by Linda Raschke
Chỉ báo
536 lượt tải
Phiên bản 1.0, Sep 2024
Windows, Mac
5.0
Đánh giá: 1
Mô tả
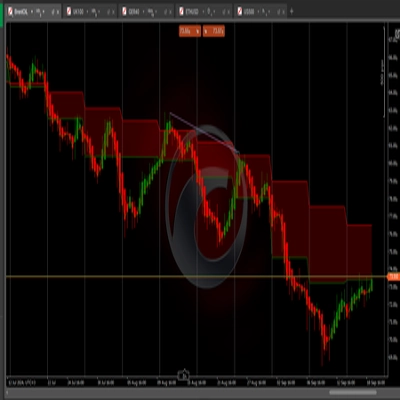
Mẫu hình này gợi ý sự hợp nhất hoặc giảm áp lực giá, nơi giá đang co lại trong một phạm vi hẹp hơn. Thị trường đang "cuộn lại" để chuẩn bị cho một đột phá tiềm năng theo bất kỳ hướng nào, thường dẫn đến một chuyển động mạnh khi nó phá vỡ tam giác.
Giao dịch khi Đột phá:
- Vào lệnh: Nhà giao dịch tìm kiếm một đột phá vượt lên trên đỉnh của mẫu hình hoặc dưới đáy của mẫu hình, chỉ ra hướng đi tiếp theo.
- Dừng lỗ: Đặt lệnh dừng lỗ bên ngoài phía đối diện của tam giác (hoặc trên đỉnh hoặc dưới đáy) giúp quản lý rủi ro.
- Mục tiêu: Một số nhà giao dịch nhắm đến một chuyển động giá bằng với kích thước của tam giác (khoảng cách giữa đỉnh và đáy của thanh đầu tiên)
Tóm tắt
Tóm tắt AI
The 3 Bar Triangle indicator by Linda Raschke identifies a consolidation pattern where price contracts within a narrowing range, forming a "triangle" shape over three bars. This pattern signals market "coiling," indicating potential for a sharp breakout in either direction once price moves beyond the triangle boundaries. Traders use this indicator to time entries by watching for a breakout above the pattern’s high or below its low, which suggests the direction of the next price move. Risk management involves placing stop-loss orders just outside the opposite side of the triangle to limit potential losses. Profit targets are often set based on the size of the triangle, aiming for a price movement equal to the distance between the high and low of the initial bar. This indicator supports breakout trading strategies by highlighting periods of price squeezing and potential volatility expansion.
Hồ sơ chỉ báo
Đánh giá của khách hàng
5.0
Đánh giá: 1
5 | 100 % | |
4 | 0 % | |
3 | 0 % | |
2 | 0 % | |
1 | 0 % |
Đánh giá của khách hàng
August 12, 2025
Pros: Identifies classic 3-bar triangle consolidation zones. Simple setup, visually clear. Stable across timeframes. Cons: No alerts or tooltips. Lacks volume filters and signal confirmation. Limited customization
Thảo luận
Câu hỏi thường gặp
Breakout
Các sản phẩm có sẵn trên cTrader Store, bao gồm bot giao dịch, chỉ báo và plugin, được cung cấp bởi các nhà phát triển bên thứ ba và chỉ nhằm mục đích cung cấp thông tin và tiếp cận kỹ thuật. cTrader Store không phải là nhà môi giới và không cung cấp lời khuyên đầu tư, khuyến nghị cá nhân hay bất kỳ đảm bảo nào về hiệu suất trong tương lai.
Sản phẩm khác của tác giả này


Giá
Kể từ 19/09/2024
314.61K
Khối lượng đã giao dịch
258.47K
Pip đạt được
536
Cài đặt miễn phí