ยินดีต้อนรับสู่ Economic Calendar ChartAlert!
เบื่อกับการสลับไปมาระหว่างแพลตฟอร์มการเทรดของคุณกับเว็บเบราว์เซอร์เพื่อตรวจสอบข่าวสารหรือไม่? Economic Calendar ChartAlert นำตารางเศรษฐกิจโลกมาไว้ที่กราฟ cTrader ของคุณ ออกแบบมาสำหรับนักเทรดรายวันและนักเทรดสวิง เพื่อให้คุณไม่พลาดข่าวที่มีผลกระทบสูงอย่างไม่คาดคิด
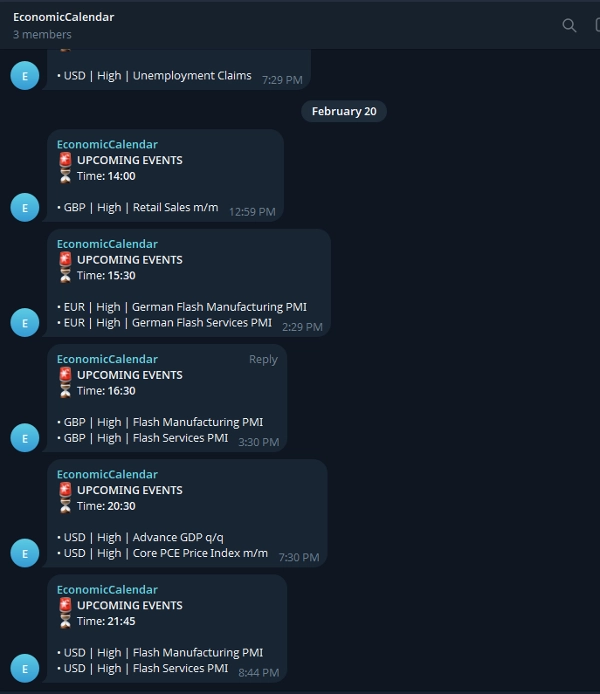
ไม่เพียงแค่แสดงเหตุการณ์ที่กำลังจะเกิดขึ้นอย่างสวยงามบนหน้าจอของคุณเท่านั้น แต่ยังมีการผสานรวม Telegram ในตัวที่ส่งการแจ้งเตือนไปยังโทรศัพท์/เดสก์ท็อปของคุณล่วงหน้า 1 ชั่วโมงก่อนเหตุการณ์สำคัญจะเกิดขึ้น
คุณสมบัติหลัก:
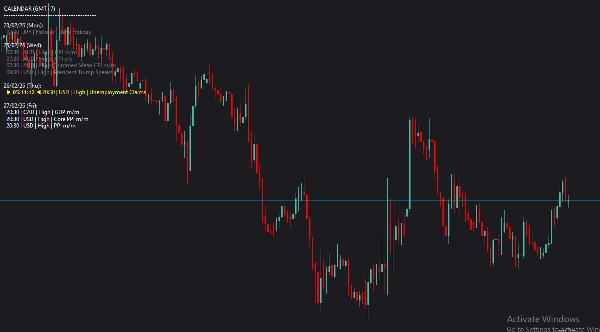
- 📊 การแสดงผลบนกราฟ: การแสดงข้อความที่สะอาด ทันสมัย และไม่รบกวนโดยใช้ฟอนต์ Roboto
- 🔔 การแจ้งเตือน Telegram อัตโนมัติ: รับการแจ้งเตือนในแชทส่วนตัวหรือกลุ่มก่อนข่าวจะเกิดขึ้น
- 🎯 การกรองอัจฉริยะ: เห็นเฉพาะข่าวที่เกี่ยวข้องกับกลยุทธ์ของคุณ กรองตามสกุลเงินหรือระดับผลกระทบที่เฉพาะเจาะจง
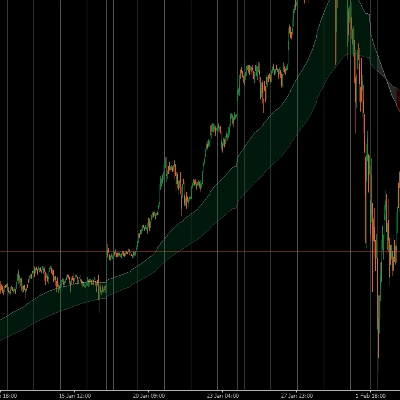
- 🎨 การใช้สีเพื่อการมองเห็น: จำแนกเหตุการณ์ที่ผ่านมา เหตุการณ์ที่ใกล้จะเกิดขึ้น (เน้น) และเหตุการณ์ในอนาคตได้ทันที
⚙️ คู่มือการตั้งค่า & คำอธิบายพารามิเตอร์
เมื่อคุณแนบตัวบ่งชี้นี้กับกราฟของคุณ คุณสามารถปรับแต่งพารามิเตอร์ต่อไปนี้ให้เหมาะกับสไตล์การเทรดของคุณได้:
การตั้งค่าการแสดงผล:
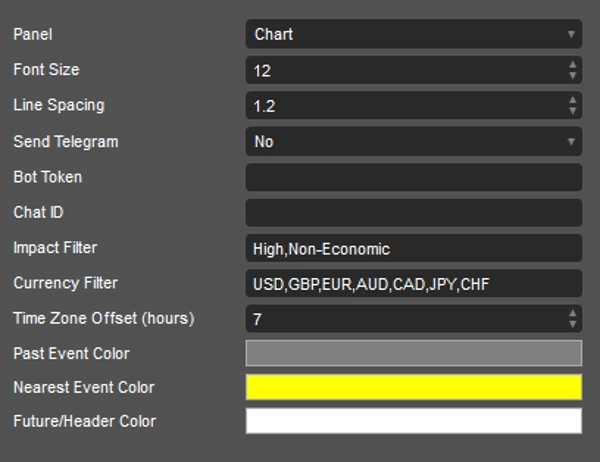
- ขนาดฟอนต์ & ระยะห่างบรรทัด: ปรับขนาดและระยะห่างของข้อความเพื่อให้ดูสมบูรณ์แบบบนความละเอียดหน้าจอของคุณ
การตั้งค่า Telegram:
- ส่ง Telegram: สลับเป็น
Yesหากคุณต้องการรับการแจ้งเตือน (การแจ้งเตือนจะถูกส่งประมาณ 1 ชั่วโมงก่อนเหตุการณ์) - โทเค็นบอท: วางโทเค็น HTTP API ของ Telegram Bot ของคุณ (สร้างผ่าน BotFather)
- รหัสแชท: ป้อนรหัสแชทส่วนตัวของคุณหรือรหัสของกลุ่ม/ช่อง Telegram ที่คุณต้องการให้ส่งการแจ้งเตือน
การตั้งค่าการกรอง (สำคัญสำหรับกราฟที่สะอาด):
- ตัวกรองผลกระทบ: พิมพ์ระดับผลกระทบที่คุณต้องการเห็นแยกด้วยเครื่องหมายจุลภาค (ค่าเริ่มต้น:
High,Non-Economic) ใช้Allเพื่อแสดงทั้งหมด - ตัวกรองสกุลเงิน: กำหนดว่าสกุลเงินใดที่คุณกำลังเทรด (ค่าเริ่มต้น:
USD,GBP,EUR,AUD,CAD,JPY,CHF) ใช้Allสำหรับทุกสกุลเงิน - การชดเชยโซนเวลา (ชั่วโมง): ปรับให้ตรงกับโซนเวลาท้องถิ่นของคุณ เช่น ใช้
7สำหรับ GMT+7
สี:
- สีเหตุการณ์ที่ผ่านมา: สีสำหรับเหตุการณ์ที่เกิดขึ้นแล้วในวันนี้ (ค่าเริ่มต้น: สีเทา)
- สีเหตุการณ์ที่ใกล้ที่สุด: เน้นเหตุการณ์ถัดไปที่กำลังจะเกิดขึ้นเพื่อให้ดึงดูดสายตา (ค่าเริ่มต้น: สีเหลือง)
- สีเหตุการณ์ในอนาคต/หัวข้อ: สีสำหรับหัวข้อปฏิทินและเหตุการณ์ที่กำลังจะเกิดขึ้น (ค่าเริ่มต้น: สีขาว)
เทรดอย่างชาญฉลาด ติดตามข่าวสาร และปล่อยให้กราฟทำงานแทนคุณ!
5 | 100 % | |
4 | 0 % | |
3 | 0 % | |
2 | 0 % | |
1 | 0 % |