Açıklama
Daha hızlı gezinme için grafik kontrol paneli — grafikten ayrılmadan yakınlaştırma, zaman dilimi ve grafik ayarı.
Yakınlaştırma ön ayarları, manuel yakınlaştırma girişi, tam zaman dilimi ve grafik seçici, yapılandırılabilir favori zaman dilimleri, dönem ayırıcılar, yuvarlak sayılar ızgarası ve canlı alış/satış çizgileri — tümü grafik üzerindeki kullanıcı arayüzü düğmeleri aracılığıyla erişilebilir. Aktif işlem oturumları sırasında cTrader'ın yerel menülerinde gezinmek için harcanan zamanı azaltmak amacıyla tasarlanmıştır.
ÖZELLİKLER
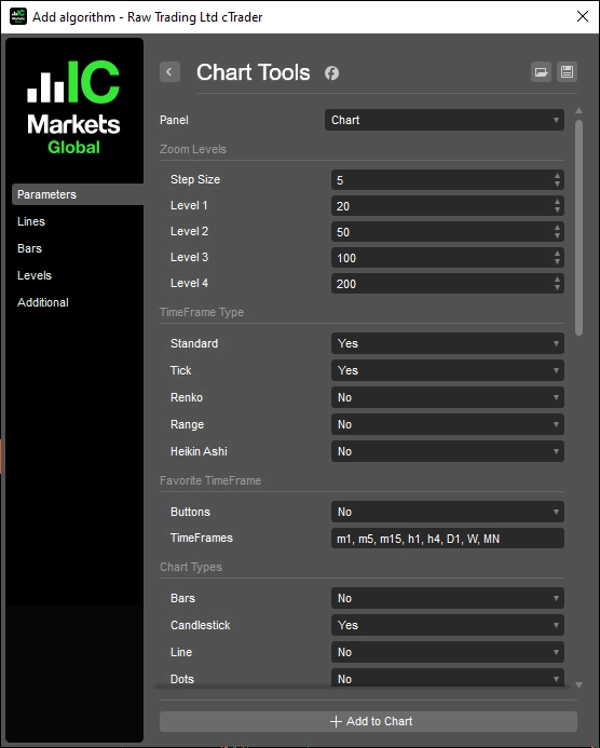
Yakınlaştırma Kontrolleri
- Yapılandırılabilir adım boyutuyla yakınlaştırma / uzaklaştırma
- Tek tıklamayla erişim için dört yapılandırılabilir ön ayar yakınlaştırma seviyesi
- Uygula düğmeli manuel yakınlaştırma girişi
- cTrader'ın yerel yakınlaştırma olayları ile senkronize olur
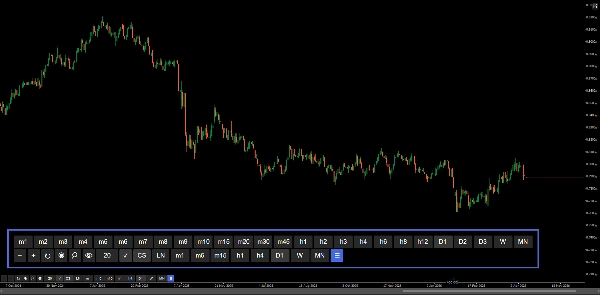
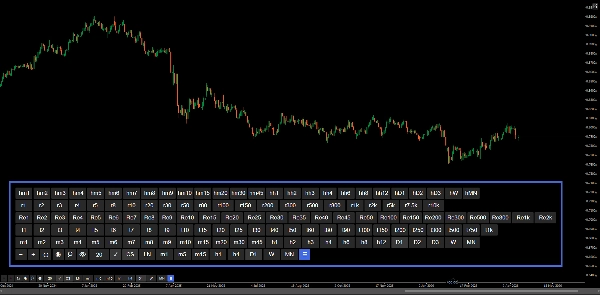
Zaman Dilimi Seçici
- Tüm zaman dilimi türlerini kapsayan tam düğme paneli: Standart, Heikin Ashi, Renko, Aralık, Tick
- Tüm mod her türü ayrı satırlar olarak gösterir
- Aktif zaman dilimi otomatik olarak vurgulanır
- ☰ düğmesi ile panel görünürlüğünü açıp kapatın
Favori Zaman Dilimleri
- Virgülle ayrılmış giriş ile yapılandırılabilir hızlı erişim satırı (örneğin m1, h1, D1)
- Aralık ve Tick dahil tüm zaman dilimi türlerini destekler
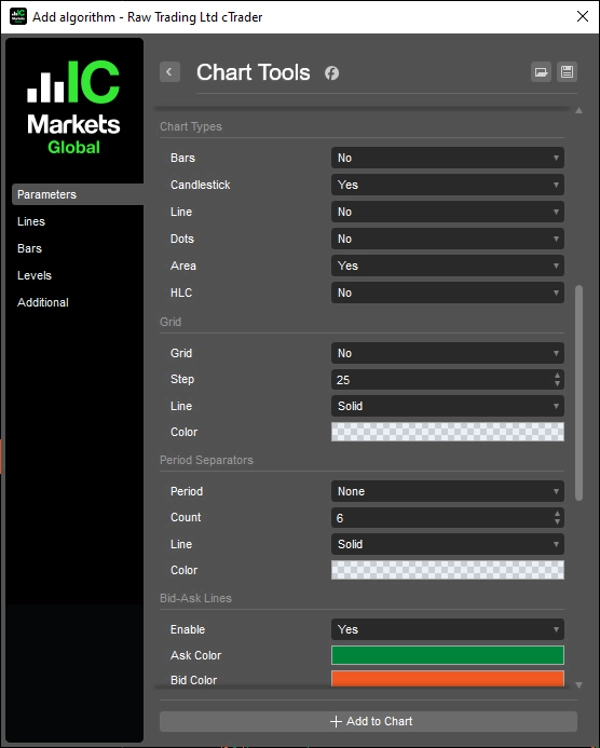
Grafik Türü
- Hızlı geçiş düğmeleri: Çubuklar, Mum Grafiği, Çizgi, Noktalar, Alan, HLC
- Aktif grafik türü otomatik olarak vurgulanır
- Her düğme parametreler aracılığıyla ayrı ayrı yapılandırılabilir
Izgara
- Yapılandırılabilir pip aralığı (Çarpan) ile yuvarlak sayılar tabanlı ızgara
- Akıllı ondalık biçimlendirmeye sahip fiyat etiketleri
- Çizgiler son çubuktan 10 çubuk öteye uzanır
- Açma/kapatma düğmesi
Dönem Ayırıcılar
- Günlük, Haftalık, Aylık ve Yıllık ayırıcılar
- Yapılandırılabilir sayım, renk, çizgi stili ve kalınlık
- Kaydırma ve yakınlaştırmada otomatik güncelleme
Alış/Satış Çizgileri
- Sonsuza uzanan canlı alış ve satış çizgileri
- Alış ve satış için yapılandırılabilir renkler
- Açma/kapatma düğmesi
Düğmeler
- Konum: Sağ Üst, Sol Üst, Sağ Alt, Sol Alt
- Yapılandırılabilir kenar boşluğu
- Yapılandırılabilir düğme renkleri ve metin renkleri — aktif durum, yakınlaştırmayı uygula ve grafik açma/kapatma düğmesi dahil
__________________________________________________________________________________________
DAHA FAZLA ÜCRETSİZ GÖSTERGE
Yapı ve hacimden regresyon, volatilite ve özel zaman dilimlerine kadar geniş bir piyasa analiz araçları yelpazesini keşfedin.
Kaynak kodu GitHub deposunda mevcuttur.
Kullanımı tamamen ücretsizdir. Ancak kahve desteği göndermek isterseniz, bunu buradan yapabilirsiniz.
Destek/Direnç
Hacim
- Hacim Aktivite Profili
- Hacim Verimlilik Analizörü
- Hacim Profili Analitiği
- Hacim Profili - Güncellenmiş
- Hacim Yayılım Analizi
- VWAP (Hacim Ağırlıklı Ortalama Fiyat)
Hareketli Ortalamalar
- SSL Kanalı
- Çapa Hareketli Ortalaması
- Sapma Ölçekli Hareketli Ortalama
- Gann Yüksek Düşük Aktivatörü
- Anlık Trend Çizgisi
- Trend Vizyonlu Kaufman Adaptif HO
- Hareketli Ortalama Kanalı
- Hareketli Ortalamalar Paketi
- Trend Kanalı Hareketli Ortalaması
Araçlar/Özel
Regresyona Dayalı
Volatilite
Osilatörler
__________________________________________________________________________________________
FERAGATNAME
Ticaret risk içerir. Bu gösterge yalnızca teknik analiz amaçlıdır — her zaman uygun risk yönetimini uygulayın ve sorumlu şekilde işlem yapın.
GERİ BİLDİRİM & GELİŞTİRMELER
Önerileriniz, özellik talepleriniz veya geliştirme fikirleriniz varsa, lütfen Tartışma sekmesinde bir yorum bırakın. Geri bildiriminiz göstergenin herkes için geliştirilmesine yardımcı olur.
Özet
Users can configure a quick-access row of favorite timeframes supporting all timeframe types. The chart type switcher offers quick buttons for Bars, Candlestick, Line, Dots, Area, and HLC charts, each with individual configuration and automatic active state highlighting.
Additional features include a round numbers-based grid with configurable pip intervals and smart decimal formatting, daily to yearly period separators with customizable appearance, and live bid/ask lines extending indefinitely with color customization and toggle options.
The control panel’s buttons can be positioned in any corner of the chart with configurable margins and colors, including active states and zoom application. This tool aims to streamline active trading sessions by reducing time spent navigating native menus, supporting efficient technical analysis on various chart types and timeframes.
Müşteri değerlendirmeleri
5 | 100 % | |
4 | 0 % | |
3 | 0 % | |
2 | 0 % | |
1 | 0 % |