![Trading product for [Stellar Strategies] Visual Trend Momentum Indicatore Signal Commodities, image 1](https://cdn.ctrader.com/image/webp/48aee0a5-f10e-4bc8-9671-78e156fcc5df_27548)
![Trading product for [Stellar Strategies] Visual Trend Momentum Indicatore Signal Commodities, image 2](https://cdn.ctrader.com/image/webp/bf3e8d6e-4fe2-498f-9c94-fcc41b457306_27549)
![Trading product for [Stellar Strategies] Visual Trend Momentum Indicatore Signal Commodities, image 3](https://cdn.ctrader.com/image/webp/606e7147-24a3-4137-b2c8-1245a4fbb93a_27550)
![Trading product for [Stellar Strategies] Visual Trend Momentum Indicatore Signal Commodities, image 4](https://cdn.ctrader.com/image/webp/c6f6508a-0abf-4df2-a2ec-8954c481ec9e_27551)
![Trading product for [Stellar Strategies] Visual Trend Momentum Indicatore Signal Commodities, image 5](https://cdn.ctrader.com/image/webp/f59e757b-aaa5-46aa-b41b-b5852db0a3ae_27552)
![Trading product for [Stellar Strategies] Visual Trend Momentum Indicatore Signal Commodities, image 6](https://cdn.ctrader.com/image/webp/60e2a71a-ca6f-467f-a22f-fd4a31226ef6_27553)
Descrizione
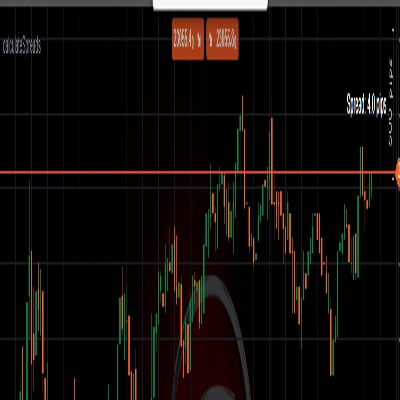
Questo indicatore cAlgo, chiamato VisualTrendMomentum, è progettato per rappresentare visivamente la forza e il momentum del trend su un grafico utilizzando una combinazione di medie mobili (MA), Average True Range (ATR) e analisi del volume. Mira a fornire ai trader un'indicazione visiva chiara di potenziali segnali di acquisto e vendita, nonché di cambiamenti di trend, attraverso icone a diamante colorate e frecce.
Caratteristiche principali:
- Rilevamento del trend:
-
- Utilizza tre medie mobili esponenziali (veloce, media e lenta) per determinare la direzione generale del trend.
- Differenzia tra segnali di acquisto/vendita "forti" e "deboli" basandosi sull'allineamento di queste MA e sui prezzi di chiusura e apertura della barra corrente.
- Analisi della volatilità:
-
- Incorpora tre indicatori ATR (breve, medio e lungo) per misurare la volatilità del mercato.
- Utilizza i livelli di volatilità per filtrare e rafforzare i segnali di acquisto/vendita.
- Conferma del volume:
-
- Analizza il volume tick per identificare picchi di volume significativi, che possono confermare la forza del trend.
- Utilizza un moltiplicatore per impostare il livello di volume significativo.
- Rilevamento del cambiamento di trend:
-
- Rileva i cambiamenti di trend confrontando lo stato attuale di forte acquisto/vendita con lo stato precedente.
- I cambiamenti di trend sono evidenziati da una freccia verso l'alto o verso il basso.
- Rappresentazione visiva:
-
- Visualizza i segnali di acquisto/vendita utilizzando icone a diamante colorate sul grafico, con colori diversi che indicano la forza del segnale (forte vs. debole).
- I cambiamenti di trend sono mostrati usando frecce verso l'alto o verso il basso.
- Il colore delle icone e delle frecce è personalizzabile tramite i parametri dell'indicatore.
- Parametri personalizzabili:
-
- L'indicatore consente agli utenti di personalizzare i periodi per le medie mobili e gli ATR, il moltiplicatore del volume e i colori utilizzati per la visualizzazione.
Come utilizzare l'indicatore:
- Aggiungi l'indicatore a cAlgo:
-
- Apri un grafico in cAlgo.
- Aggiungi l'indicatore [Stellar Strategies]
VisualTrendMomentumal grafico dalla lista "Indicators".
- Configura i parametri:
-
- Regola i parametri di input in base al tuo stile di trading e al mercato specifico che stai analizzando.
-
Fast MA Period,Medium MA Period,Slow MA Period: Imposta i periodi per le medie mobili esponenziali.Short ATR Period,Medium ATR Period,Long ATR Period: Imposta i periodi per gli indicatori average true range.Significant Volume Multiplier: Regola il moltiplicatore per definire i livelli di volume significativo.Strong Buy Color,Strong Sell Color,Weak Buy Color,Weak Sell Color,Trend Change Color: Scegli i colori per i diversi tipi di segnale.
- Interpreta i segnali:
-
- Diamanti colorati:
-
- Diamanti verde scuro: segnali di acquisto forti.
- Diamanti rosso scuro: segnali di vendita forti.
- Diamanti oliva: segnali di acquisto deboli.
- Diamanti marroni: segnali di vendita deboli.
- Frecce:
-
- Freccia dorata verso l'alto: indicazione di un cambiamento di trend da vendita ad acquisto.
- Freccia dorata verso il basso: indicazione di un cambiamento di trend da acquisto a vendita.
- Forza del trend:
-
- La combinazione di icone a diamante e livelli di volume fornisce un'idea della forza del trend attuale. Un volume più alto con un diamante di acquisto/vendita forte rafforza il segnale.
- Decisioni di trading:
-
- Usa i segnali dell'indicatore insieme ad altri strumenti di analisi tecnica e alla tua strategia di trading.
- Considera il contesto generale del mercato e la gestione del rischio prima di prendere qualsiasi decisione di trading.
- Note importanti:
-
- Poiché l'indicatore utilizza medie mobili e indicatori ATR, è un indicatore ritardato.
- L'indicatore è più efficace nei mercati in trend.
- Regola i parametri per adattarli alle condizioni di mercato.
................................................................................................................................................................................................................
Avvertenza per i trader: Il trading comporta rischi significativi e non è adatto a tutti gli investitori. Potresti perdere parte o tutto il capitale investito. Assicurati sempre di comprendere appieno i rischi e di cercare consulenza finanziaria indipendente se necessario. L'indicatore Visual Trend Momentum è uno strumento per aiutare a identificare trend e potenziali opportunità di trading, ma non garantisce operazioni redditizie.
Riepilogo
Trend changes are detected by comparing current and previous strong buy/sell states and are marked with up or down arrows. Buy and sell signals appear as colored diamond icons on the chart, with colors indicating signal strength (strong vs. weak). All visual elements’ colors and indicator parameters—including MA and ATR periods and volume multiplier—are customizable.
Users add the indicator to cAlgo charts, configure parameters to suit their trading style and market, and interpret signals alongside other analysis tools. The indicator is lagging by nature and is most effective in trending markets. It provides visual cues to assist in identifying trends and potential trading opportunities but does not guarantee profitable trades.
Recensioni dei clienti
5 | 100 % | |
4 | 0 % | |
3 | 0 % | |
2 | 0 % | |
1 | 0 % |
![Logo di "[Stellar Strategies] Market Structure Breakout"](https://cdn.ctrader.com/image/webp/bceec265-3247-4b11-915f-6295a29c106d_28465)
![Logo di "[Stellar Strategies] Market Session Ultimate"](https://cdn.ctrader.com/image/webp/61ffd537-0125-4246-9e72-42eca1791d64_28232)
![Logo di "[Stellar Strategies] BOS Trend 1.0"](https://cdn.ctrader.com/image/webp/6cdec0f1-0e97-4a82-a8a4-2b67aed54d38_25695)
![Logo di "[Stellar Strategies] Inside Bar with Signals"](https://cdn.ctrader.com/image/webp/1d9e8bfa-3b2c-4440-bb37-5856902008a7_30683)
![Logo di "[Stellar Strategies] Wave Trend Pro"](https://cdn.ctrader.com/image/webp/5f226fbb-245a-41cd-9cdd-b018257d5e6d_28617)
![Logo di "[Stellar Strategies] Smart ADX"](https://cdn.ctrader.com/image/webp/af13b084-b6f6-41db-b7bc-c7e688b57b05_36929)
![Logo di "[Stellar Strategies] Linear Regression Candles 1.1"](https://cdn.ctrader.com/image/webp/8b9cff9f-2431-46d2-b0ec-c7f55f4a4a6d_27918)
![Logo di "[Stellar Strategies] VBO"](https://cdn.ctrader.com/image/webp/f034c012-94d4-445a-a01b-febd1cdedaef_36944)
![Logo di "[StellarStrategies] Scheduled Trade Executor"](https://cdn.ctrader.com/image/webp/daefc6af-7eca-453e-878d-1b981be2c401_25646)
![Logo di "[Stellar Strategies] Candlestick Patterns Dashboard"](https://cdn.ctrader.com/image/webp/ae8691a5-4884-4553-9bcc-64e16ac82a30_38344)
![Logo di "[Stellar Strategies] SP500 Gap Closure cBot 1.0"](https://cdn.ctrader.com/image/webp/92c23fdc-4ad1-4e61-bdb5-c77f6ec8c539_27686)
![Logo di "[Stellar Strategies] QQE"](https://cdn.ctrader.com/image/webp/e702104a-874c-4b39-97dd-fb34518d1015_27712)