Descrizione
Descrizione del prodotto: BullMoon Performance Panel
Il BullMoon Performance Panel è uno strumento analitico potente per cTrader, progettato per aiutare i trader a monitorare le proprie prestazioni in tempo reale e a ricostruire visivamente le operazioni passate direttamente sul grafico.
1. Dati di mercato e condizioni
Il pannello analizza i tuoi dati di trading relativi al conto e i dati storici dei prezzi del simbolo selezionato.
- Valuta sia le operazioni chiuse che quelle in corso per calcolare metriche chiave come il profitto netto, il drawdown e il tasso di vincita.
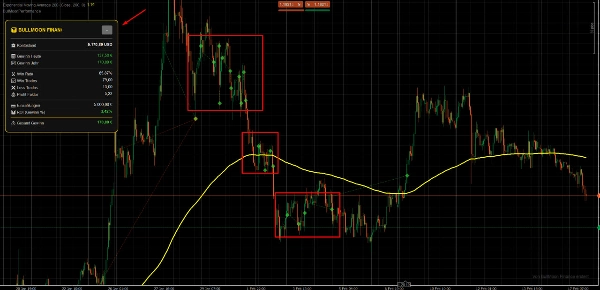
- L'indicatore esamina la tua cronologia per individuare con precisione i punti di entrata e uscita.
2. Interpretazione dei segnali e degli elementi visivi
Per rendere l'analisi il più intuitiva possibile, lo strumento utilizza marcatori visivi chiari direttamente sul grafico:
- Simboli: Entrate e uscite sono contrassegnate con simboli specifici (ad esempio, frecce o punti), permettendoti di vedere immediatamente dove una posizione è stata aperta e chiusa.
- Linee visive: Le linee che collegano questi simboli illustrano la durata dell'operazione, rendendo tangibili visivamente le fasi di profitto o perdita.
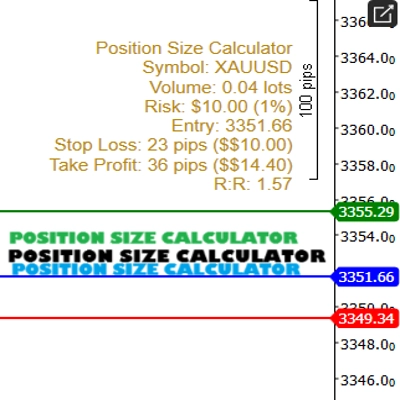
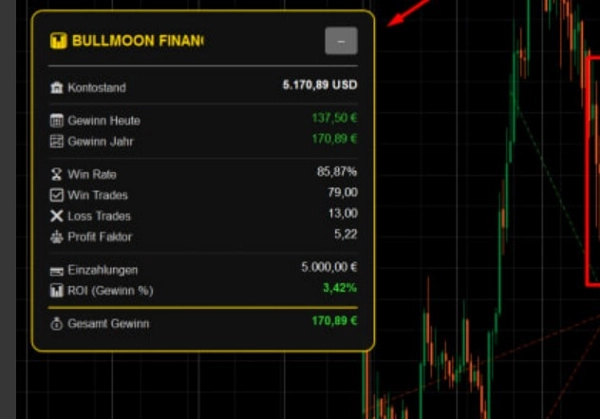
- Dashboard: Un dashboard compatto sullo schermo fornisce dati concreti, inclusi profitto in USD, lotti totali scambiati e il fattore R.
3. Impostazioni e parametri chiave
Puoi personalizzare il pannello per adattarlo al tuo stile di trading specifico:
- Periodo storico: Definisci quanti giorni di operazioni passate devono essere visualizzati sul grafico.
- Aspetto visivo: I colori per le operazioni vincenti e perdenti, così come la trasparenza di linee e simboli, sono completamente regolabili.
- Base di calcolo: Imposta dimensioni fisse dei lotti o un rischio basato su percentuale per l'output statistico.
4. Casi d'uso tipici e scenari di trading
- Analisi post-trade: Rivedi la tua giornata di trading per assicurarti di aver seguito correttamente la tua strategia.
- Ottimizzazione della strategia: Identifica visivamente se i tuoi livelli di Take Profit o Stop Loss sono impostati costantemente troppo stretti o troppo ampi.
- Monitoraggio in tempo reale: Tieni traccia delle tue prestazioni giornaliere attuali senza dover passare continuamente alla scheda della cronologia del conto.
5. Pubblico target (dimensione del conto ed esperienza)
- Livello di esperienza: Adatto a principianti che desiderano acquisire una migliore percezione delle proprie operazioni, così come a professionisti che necessitano di un rapido controllo visivo delle prestazioni.
- Dimensione del conto: Adatto a qualsiasi dimensione di conto. È particolarmente prezioso per i trader che gestiscono più strategie contemporaneamente e che devono mantenere una panoramica chiara.
6. Limitazioni importanti e note sull'uso
- Piattaforma: Sviluppato esclusivamente per cTrader.
- Disponibilità dei dati: La visualizzazione delle operazioni storiche dipende dalla disponibilità dei dati nella cronologia del tuo conto cTrader.
- Non è un generatore di segnali: Si prega di notare che questo pannello è uno strumento analitico e non genera segnali di acquisto o vendita indipendenti.
Riepilogo
The panel features a compact dashboard displaying key statistics including profit in USD, total lots traded, and the R-factor. Users can customize the display period for historical trades, adjust colors and transparency of visual elements, and set calculation parameters based on fixed lot sizes or percentage risk.
Typical use cases include post-trade analysis, strategy optimization by evaluating take profit and stop loss settings, and live monitoring of daily performance without switching views. The tool supports various markets and symbols such as Forex (EURUSD, GBPUSD, USDJPY), Indices (NAS100), Commodities (XAUUSD), Crypto (BTCUSD), and Stocks. It is suitable for traders of all experience levels and account sizes, especially those managing multiple strategies simultaneously. The panel is strictly an analytical tool and does not generate trade signals.
Recensioni dei clienti
5 | 100 % | |
4 | 0 % | |
3 | 0 % | |
2 | 0 % | |
1 | 0 % |