
Descrizione
L'indicatore TECHNICAL ANALYSIS è una soluzione avanzata di analisi tecnica sviluppata per la piattaforma cAlgo, che integra più indicatori tecnici focalizzati sull'identificazione di tendenze robuste, momentum di mercato e conferma del volume. Combina l'ADX (Average Directional Index) con l'analisi della pendenza, il filtraggio del volume e l'analisi tecnica multi-indicatore in tempo reale, offrendo ai trader una visione completa e affidabile per il processo decisionale.
🔍 Strategia Principale
1. Base: ADX + DI (Directional Movement System)
Il nucleo dell'indicatore è l'ADX (Average Directional Index), che misura la forza della tendenza.
I componenti +DI (Indicatore Direzionale Positivo) e -DI (Indicatore Direzionale Negativo) identificano la direzione della tendenza:
+DI > -DI → Tendenza rialzista
-DI > +DI → Tendenza ribassista
2. Analisi Dinamica del Momentum con la Pendenza
La pendenza di ADX, +DI e -DI è calcolata utilizzando la regressione lineare.
Questo permette di identificare se la tendenza sta:
Acquisendo forza (pendenza positiva)
Perdendo forza (pendenza negativa)
3. Livelli di Riferimento
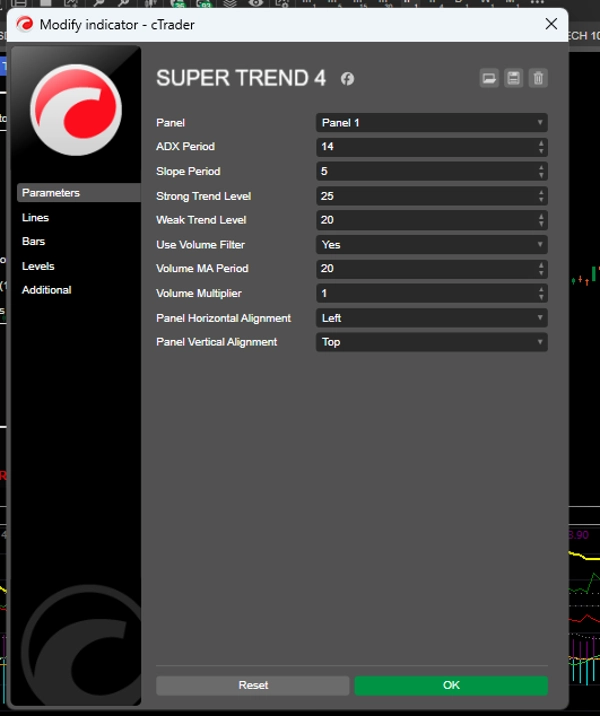
Livello di Tendenza Forte: Livello sopra il quale la tendenza è considerata forte (predefinito: 25)
Livello di Tendenza Debole: Livello minimo per considerare valida una tendenza (predefinito: 20)
Le tendenze al di sotto del livello debole sono trattate come laterali o senza una direzione chiara.
📈 Generazione di Segnali
Condizioni di Acquisto
✅ +DI che incrocia sopra -DI
✅ ADX sopra il livello di tendenza debole (Livello di Tendenza Debole)
✅ Pendenze positive di ADX e +DI
✅ Conferma del volume (opzionale)
Condizioni di Vendita
✅ -DI che incrocia sopra +DI
✅ ADX sopra il livello di tendenza debole (Livello di Tendenza Debole)
✅ Pendenze positive di ADX e -DI
✅ Conferma del volume (opzionale)
Segnali Forti: Quando l'ADX è sopra il Livello di Tendenza Forte e le pendenze sono significativamente positive, l'indicatore genera segnali rafforzati, evitando entrate consecutive ripetute. 📊 Filtro del Volume (Opzionale)
L'indicatore può richiedere la conferma del volume prima di generare segnali.
Il volume attuale deve essere maggiore o uguale alla media mobile del volume × moltiplicatore.
Questo aiuta a filtrare falsi breakout e segnali in mercati illiquidi.
🧠 Analisi Tecnica Avanzata (Pannello Interattivo)
TECHNICAL ANALYSIS include due pannelli interattivi sul grafico:
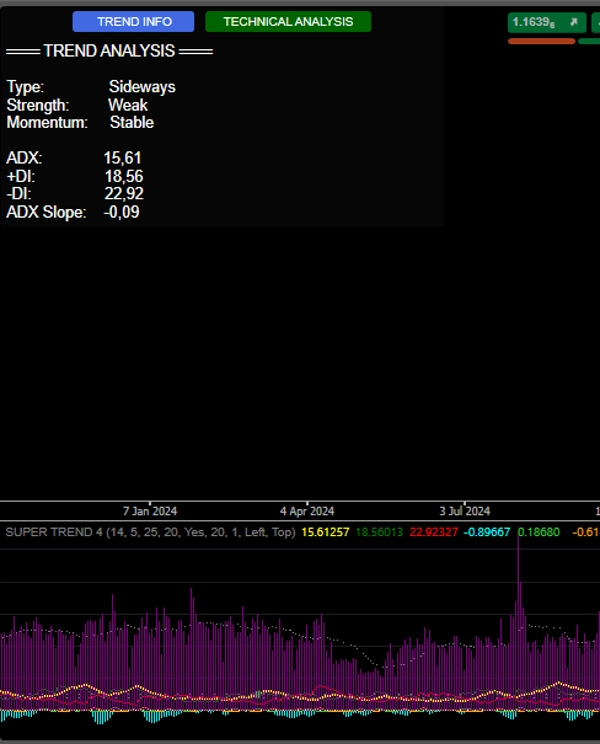
1. INFORMAZIONI SULLA TENDENZA
Tipo di Tendenza: Rialzista / Ribassista / Laterale
Forza della Tendenza: Forte / Debole
Momentum: Rafforzamento / Indebolimento / Stabile
Valori correnti di ADX, +DI, -DI e Pendenza
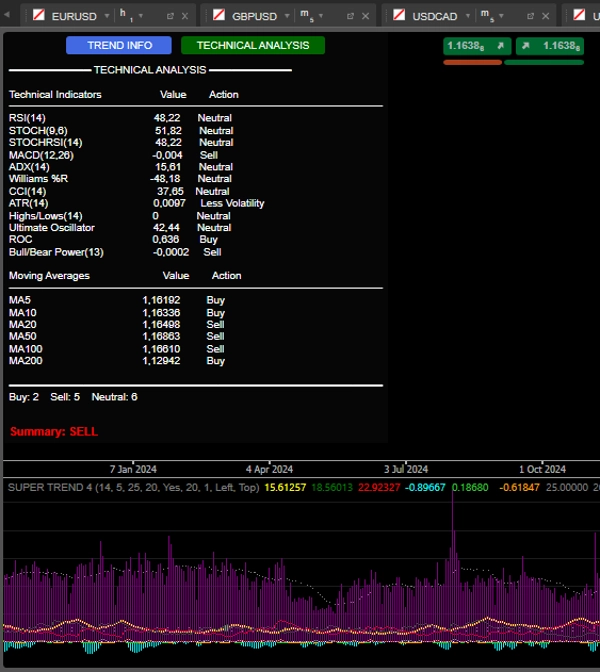
2. ANALISI TECNICA
Esegue un'analisi multi-indicatore in tempo reale, includendo:
RSI(14) – Ipercomprato/Ipervenduto
Stocastico(14) – Momentum
MACD(12,26) – Incroci e divergenze
Williams %R – Estremi di mercato
CCI(14) – Deviazioni dal prezzo tipico
ROC(12) – Tasso di variazione
Oscillatore Ultimo – Conferma della forza
Bull/Bear Power – Pressione di acquisto/vendita
Medie Mobili (5,10,20,50,100,200) – Tendenza a lungo termine
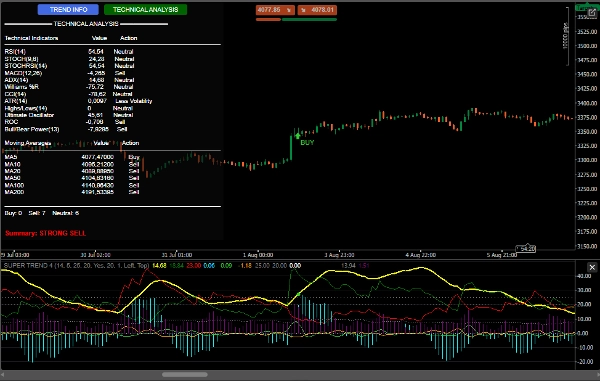
Riepilogo Finale: Il sistema conta i segnali di acquisto/vendita/neutri e emette una raccomandazione chiara:
FORTE ACQUISTO (≥7 segnali di acquisto)
ACQUISTO
VENDITA
FORTE VENDITA (≥7 segnali di vendita)
NEUTRALE
🔔 Avvisi e Visualizzazione
Segnali visivi sul grafico:
Frecce verdi/rosse con etichette "BUY"/"SELL"
Notifiche sonore (Windows)
Log dettagliati nella console con:
Ora del segnale
Valori di ADX, DI e volume (se abilitati)
🛡️ Vantaggi Competitivi
✅ Integrazione di più indicatori in un unico pannello
✅ Focus sulla forza e direzione della tendenza (non solo prezzo)
✅ Filtro del volume per maggiore affidabilità
✅ Interfaccia interattiva e informativa
✅ Segnali chiari con avvisi visivi e sonori


![Logo di "[Hamster-Coder] Bollinger Bands"](https://cdn.ctrader.com/image/webp/21d8e5d6-fb11-4bac-b9ee-cd05c2b76804_30327)
![Logo di "Trend Angle Indicator [Iridio Capital]"](https://cdn.ctrader.com/image/webp/28a98496-3412-4fea-82eb-be3347bdd6f1_27612)