
FAMA-MAMA
مؤشر
الإصدار 1.0، May 2025
Windows, Mac
5.0
التقييمات: 1
الوصف
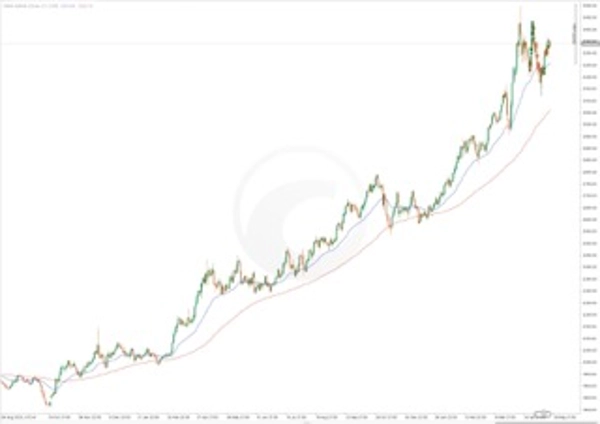
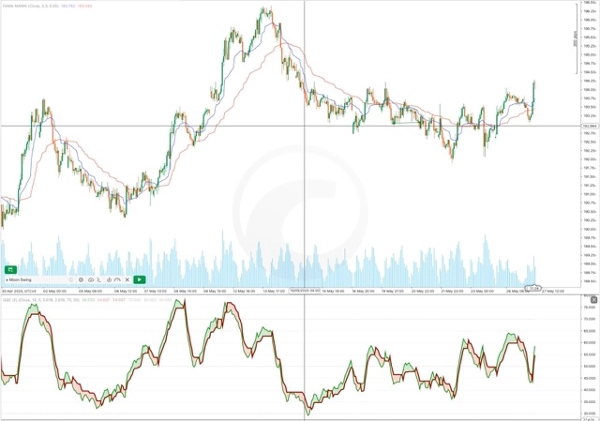
مؤشر FAMA-MAMA هو أداة اتجاه ديناميكية وتكيفية تم تصميمها للمتداولين الذين يحتاجون إلى رؤية أوضح لاتجاه السوق. بناءً على المتوسط المتحرك التكيفي MESA (MAMA) وخط المرافق له (FAMA)، يقوم هذا المؤشر بالتكيف مع تغيرات ظروف السوق لتسليط الضوء على تحولات الاتجاه وتقليل ضوضاء الرسم البياني.
النقاط البارزة:
- خطوط الاتجاه التكيفية: يقوم MAMA بالتكيف مع دورات السوق، مما يجعله أكثر استجابة في ظروف الاتجاه وأملس في ظروف التذبذب.
- إشارات تقاطع واضحة: يتم توليد إشارات الشراء والبيع عندما يتقاطع MAMA مع FAMA.
- إعدادات قابلة للتخصيص: غيّر الألوان وأنماط الخطوط والحساسية لتناسب استراتيجيتك وتفضيلاتك البصرية.
- تكامل بصري: يعرض مباشرة على الرسم البياني الخاص بك لتسهيل التعرف على الإشارات.
منطق الإشارة:
- عندما يتقاطع MAMA فوق FAMA → زخم صاعد
- عندما يتقاطع MAMA تحت FAMA → زخم هابط
مناسب لأنماط تداول متعددة بما في ذلك التداول اليومي والتداول المتأرجح، يساعد هذا المؤشر المتداولين على تتبع اتجاهات السوق بوضوح وثقة.
الملخص
ملخص الذكاء الاصطناعي
The FAMA-MAMA Indicator is an adaptive trend-following tool designed to provide clearer insight into market direction. It is based on the MESA Adaptive Moving Average (MAMA) and its companion line, FAMA. This indicator dynamically adjusts to changing market conditions, enhancing responsiveness during trending phases and smoothing out noise in ranging markets.
Key features include:
- Adaptive trend lines that respond to market cycles.
- Clear buy and sell signals generated when MAMA crosses above or below FAMA, indicating upward or downward momentum respectively.
- Customizable settings allowing users to modify colors, line styles, and sensitivity to align with their trading strategies and visual preferences.
- Direct chart integration for straightforward signal recognition.
Suitable for various trading styles such as intraday and swing trading, the FAMA-MAMA Indicator assists traders in tracking market trends with improved clarity and confidence.
ملف تعريف المؤشر
تقييمات العملاء
5.0
التقييمات: 1
5 | 100 % | |
4 | 0 % | |
3 | 0 % | |
2 | 0 % | |
1 | 0 % |
مناقشة
الأسئلة الشائعة
Signal
يتم توفير المنتجات المتاحة من خلال cTrader Store، بما في ذلك روبوتات التداول والمؤشرات والإضافات، من قبل مطوري الطرف الثالث وإتاحتها لأغراض الوصول المعلوماتي والفني فقط. cTrader Store ليس وسيطًا ولا يقدم نصائح استثمارية أو توصيات شخصية أو أي ضمان للأداء المستقبلي.


السعر
12
المبيعات
415
التثبيتات المجانية