Açıklama
🏆 10.000+ Trader, 25+ Algoritma Paketimize Güveniyor! 🏆
Den Piyasa Yapısı & Likidite ile Akıllı Çıkış Sistemleri & Öngörü Araçlarına - tutarlı sonuçlar için İHTİYACINIZ olan HER aracı geliştirdik.
👉 Tüm 25+ KANITLANMIŞ Sisteme Erişin:
_______________________________________________
📌 Piyasa Yapısı Göstergeleri
· ✅ Gelişmiş Piyasa Yapısı: Bos, Choch, SwinLevels, Emir Blokları, Piyasa Yapısı& Likidite Bulucu
· 🔄 Dönüş Noktalarının Dinamik Piyasa Yapısı Analizi
· 🧱 Emir Bloğu
· ⚖️ Piyasa Dengesizliği
· ⛓️ BOS & CHOCH
· 🧠 ICT 3 Gücü
_______________________________________________
🔚 Akıllı Çıkış Sistemleri
· 📍 Takip Eden Akıllı Algoritma
_______________________________________________
📐 ZigZag Göstergeleri
· 🔍 ZigZag Fiyat Likidite Projeksiyonu
· ➖ ZigZag
· 🎯 Zig-Zag Uç Nokta Takipçisi
_______________________________________________
🧱 Destek & Direnç Göstergeleri
· 🟩 Akıllı Trend Destek & Direnç Çizgileri
· 🧱 Tüm Destek ve Direnç Seviyeleri
_______________________________________________
📊 Trend & Kanal Göstergeleri
· 📊 Süpertrend
· 🧠 Uyarlanabilir Trend Kanalı
· 🔁 Reaktif Hareketli Ortalama
_______________________________________________
💧 Hacim & Likidite Araçları
· 🔍 Momentum Adil Değer Boşluğu
· 🕒 Adil Değer Boşluğu Seansları
_______________________________________________
⚡ Momentum & RSI Göstergeleri
· 🔎 Çok Katmanlı Mum Eğilimi
Takipçisi
_______________________________________________
🔮 Tahmin & Projeksiyon Araçları
· 📐 Linreg & ATR Tabanlı Tahmin
· 📏 Fibonacci Doğrusal Regresyon Çok Zamanlı
· 📈 Hacim Destekli Piyasa Akışı Projeksiyonu_________________________
_________________________________________________________________________________________________
_________________________________________________________________________________________________
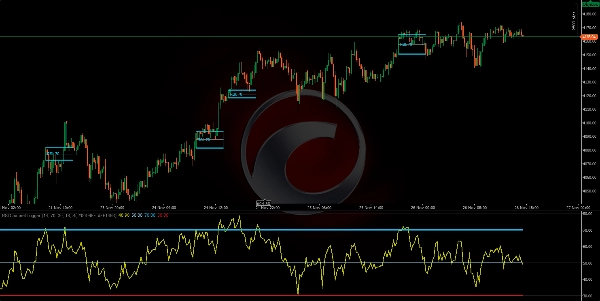
RSI KANAL TETİKLEYİCİSİ: 📶
Nedir: RSI(period) hesaplayan ve RSI aşırı alım/aşırı satım eşiklerini (varsayılan 70/30) geçtiğinde momentum bölgelerini görsel olarak işaretleyen bir gösterge. ✅
https://chartshots.spotware.com/c/69278f8b6d973
Mantık: Bir eşik aşıldığında, geçiş anındaki mumun yüksek/düşük değerlerine dayalı bir "bölge" oluşturur. Sonra: 🧠
- O bölge içindeki mumları renklendirir.
- Bir kanal çizer (yüksek, düşük, orta).
- RSI panelinde geçişi bir daire ve etiketle işaretler.
Bölge tam olarak MinZoneDuration bar sürer. ⏱️
Net sinyaller:
- Aşırı Alımın Üzerinde Geçiş → boğa bölgesi başlatır. 🟢
- Aşırı Satımın Altında Geçiş → ayı bölgesi başlatır. 🔴
Bölge kendisi bir ilgi alanıdır, emir değildir.
https://chartshots.spotware.com/c/69278fb274e0b
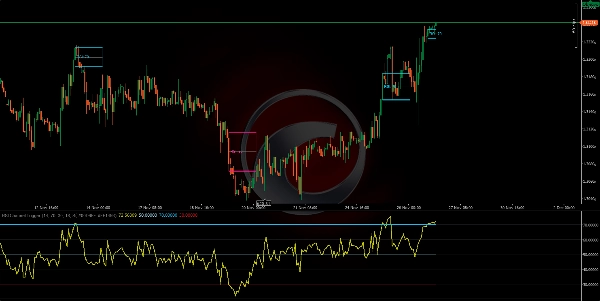
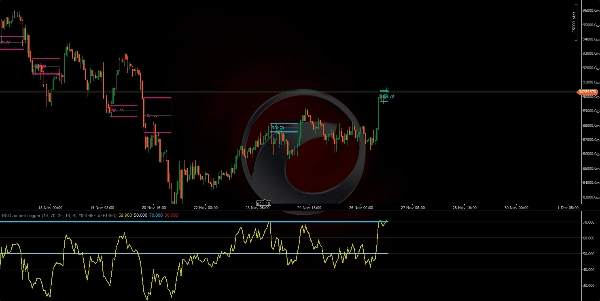
Nasıl kullanılır (hızlı):
- Bölgenin oluşmasını bekleyin. 🎯
- Fiyat hareketi ile onaylayın (kanal çizgilerinden kırılma/red).
- Bölge dışında bir zarar durdurma ile ve orta kanal çizgisinde veya tanımlı Risk/Kazanç oranında bir hedefle giriş yapın.
https://chartshots.spotware.com/c/69278fe76237b
Ana Parametreler: ⚙️
- RSI Periyodu (14)
- Aşırı Alım (70)
- Aşırı Satım (30)
- MinZoneDuration (15)
- Ayarlanabilir renkler 🎨
Özet
Clear signals include:
- RSI crossing above the overbought level, initiating a bullish momentum zone.
- RSI crossing below the oversold level, initiating a bearish momentum zone.
These zones serve as areas of interest rather than direct trade orders. Users can confirm signals with price action such as breakouts or rejections from channel lines and plan entries with stop losses placed outside the zone and targets at the mid-channel line or based on risk/reward ratios.
The indicator supports multiple markets and symbols including Forex pairs (EURUSD, GBPUSD, NZDUSD, USDJPY), commodities (XAUUSD), indices (NAS100), cryptocurrencies (BTCUSD), and stocks. It offers configurable parameters for RSI period, threshold levels, zone duration, and colors.