present
Sign up and get $50 off your first purchase
Trading product for MACD Custom Indicator - Multiple Time Frame Indicator EMA Volume, image 1
MACD Custom Indicator - Multiple Time Frame
Indicator
1 purchases
Version 1.0, May 2026
Windows, Mac
4.2
Reviews: 4
Trading product for MACD Custom Indicator - Multiple Time Frame Indicator EMA Volume, image 2
Trading product for MACD Custom Indicator - Multiple Time Frame Indicator EMA Volume, image 3
Trading product for MACD Custom Indicator - Multiple Time Frame Indicator EMA Volume, image 4
Trading product for MACD Custom Indicator - Multiple Time Frame Indicator EMA Volume, image 5
54
Sales
4.97K
Free installs

Description

πŸ”₯ **PrimeQuant CM Ultimate MACD MTF v1.0** πŸ”₯


**The Perfect TradingView-to-cTrader MACD Upgrade**

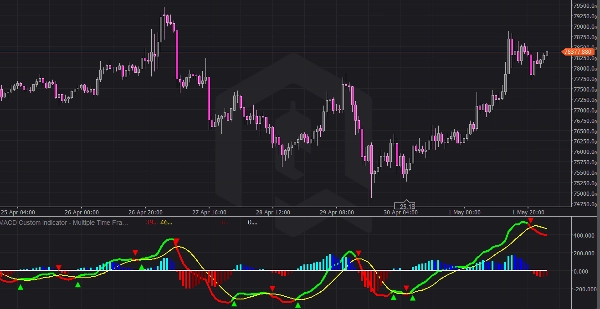
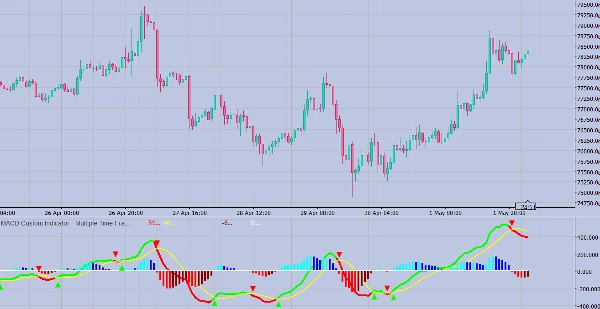
βœ… Exact visual replica of the famous CM MACD Ultimate MTF Pine Script

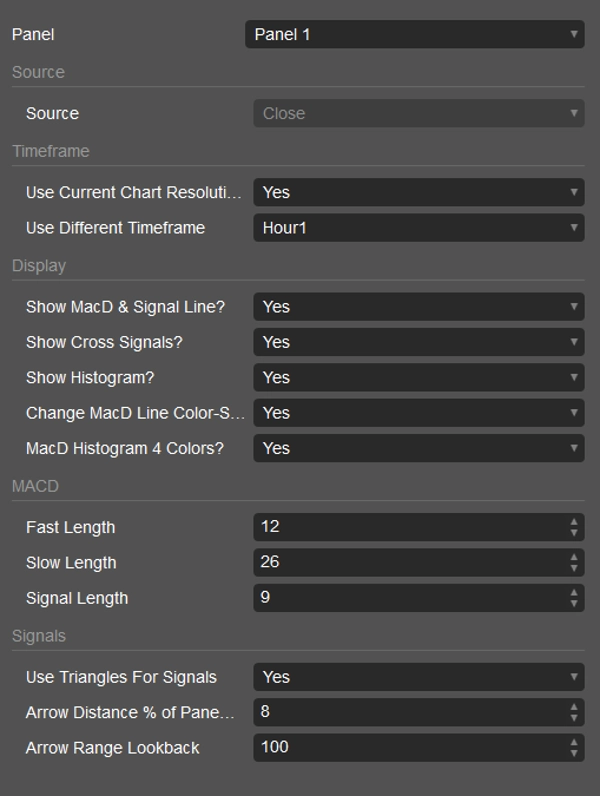
βœ… Multi-timeframe support (current chart or custom HTF)

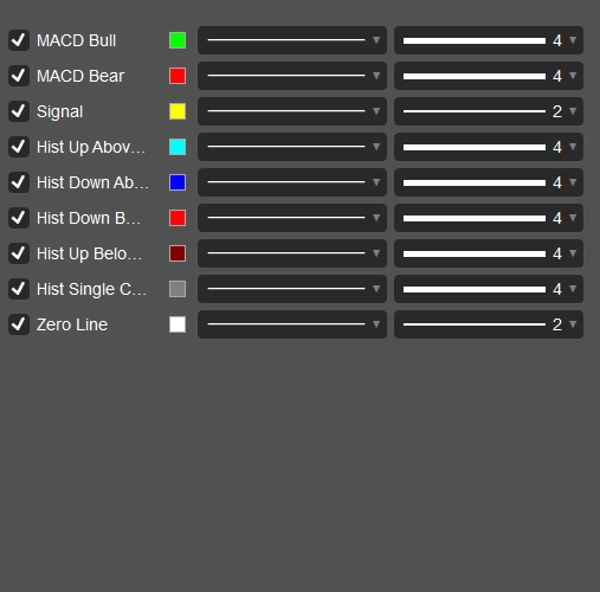
βœ… Continuous MACD line with dynamic green/red trend coloring

βœ… Yellow signal line

βœ… 4-color histogram (above/below zero transitions)

βœ… Triangle cross signals (up/down arrows with perfect spacing)

βœ… Zero reference line


**🎯 Key Features:**

- **πŸ“Š MTF Flexibility**: Use current timeframe or select custom HTF (1m-1M)

- **🎨 Smart Coloring**: MACD line changes green/red on signal cross

- **πŸ“ˆ 4-Color Histogram**: Aqua/blue above zero, red/maroon below

- **πŸ”ΊπŸ”» Triangle Signals**: Clean up/down arrows at cross points

- **βš™οΈ Full Customization**: Toggle every element independently


**πŸš€ How to Use:**

1. **Add to Chart** β†’ Appears in separate panel

2. **Current TF** β†’ Check "Use Current Chart Resolution" (default)

3. **Higher TF** β†’ Uncheck + select timeframe (e.g., H1 on M5 chart)

4. **Signals** β†’ Enable "Show Cross Signals" for triangle markers

5. **Customize** β†’ Adjust colors, distances, histogram styles


**πŸ“ˆ Trading Signals:**

- πŸ”Ί **Green Up Triangle** = MACD crosses ABOVE signal (bullish)

- πŸ”» **Red Down Triangle** = MACD crosses BELOW signal (bearish)

- **Green MACD** = Above signal (bullish bias)

- **Red MACD** = Below signal (bearish bias)

- **Histogram Divergence** = Watch for momentum shifts


**πŸ’Ž PrimeQuant Quality**

Built for cTrader 5.6.10+ | Zero errors | Native performance | Professional visuals


**⭐ Perfect for:** Scalpers, swing traders, HTF analysis on lower charts

Summary

AI summary
The MACD Custom Indicator - Multiple Time Frame is a momentum indicator designed for the cTrader platform, replicating the visual style of the CM MACD Ultimate MTF Pine Script from TradingView. It supports multi-timeframe analysis, allowing users to apply the MACD calculation on the current chart timeframe or select a custom higher timeframe ranging from 1 minute to 1 month. The indicator features a continuous MACD line that dynamically changes color (green/red) based on trend direction, a yellow signal line, and a four-color histogram that visually distinguishes momentum shifts above and below zero. Triangle-shaped cross signals mark bullish and bearish MACD-signal line crossovers with up and down arrows, respectively. A zero reference line is also included for trend context. Users can fully customize the display elements independently, including colors, distances, and histogram styles. The indicator appears in a separate panel on the chart and is suitable for scalpers, swing traders, and higher timeframe analysis on lower timeframe charts. It provides visual signals for trend strength, crossovers, and potential momentum divergences to assist in trading decisions.
Indicator profile
Indicator category
Momentum
Output type
Visualisation
Signals
Data requirements
Bars only
Supported signals
Cross
Divergence
Reversal
Trend strength

Customer reviews

4.2
Reviews: 4
5
25 %
4
75 %
3
0 %
2
0 %
1
0 %
Customer reviews
May 17, 2026
messy signals are easier to question, but it should not replace the chart.
May 16, 2026
Demo first, then maybe small size if the notes look sane, and forcing the entry still creates problems.
May 14, 2026
May 4, 2026
Tbh it is not magic, just a decent extra filter. Risk cannot be ignored.

Discussion

FAQ

EMA
Volume
MACD
Triangle
Moving Average
VWAP
Support & Resistance
Products available through cTrader Store, including trading bots, indicators and plugins, are provided by third-party developers and made available for informational and technical access purposes only. cTrader Store is not a broker and does not provide investment advice, personal recommendations or any guarantee of future performance.

More from this author

Indicator
ATR
SMC
+19
Free Smart Money Concepts from TradingView for cTrader: BOS/CHoCH, OB, FVG, liquidity, MTF levels, discount zones.
Indicator
ATR
SMC
+18
Precision SMC tool with HTF sweeps, MSS confirmation & smart FVG detection for high-probability reversals.
Indicator
ATR
Prop
+16
Get the exact SuperTrend experience from TV, now perfectly rebuilt for cTrader
Indicator
Prop
ZigZag
+5
All-in-One ICT/SMC Institutional Framework β€” Ranges, Structure, Liquidity, Fibonacci & Time Engine.
Indicator
RSI
MACD
+5
WaveTrend Oscillator with signal line, spread histogram and OB/OS levels for precise momentum trading.
Indicator
ATR
SMC
+19
Smart Liquidity Sweep detector with auto-drawing True Channels and real market structure mapping.
Indicator
ADX
ATR
+5
Precision Sniper by PrimeQuant: Advanced confluence engine with auto-presets, dynamic TP/SL, and live backtest stats.
Indicator
Forex
BTCUSD
+11
πŸ“ˆ Adaptive ALMA-Gaussian hybrid trend filter with precision smoothing and clear buy/sell signals.
cBot
SMC
Forex
+11
πŸ’Ž ICT Silver Bullet Strategy cBot β€” liquidity sweep & breakout algorithm with risk control.
Indicator
Forex
Crypto
+5
Γ°ΒŸΒšΒ€ Automated Elliott Wave & Fibonacci tool for cTrader. Spot trends, corrections & retracements fast.
Indicator
ATR
SMC
+17
Adaptive Swing-Anchored VWAP that tracks market structure shifts with precision and clarity.
Indicator
SMC
Forex
+15
Smart institutional order block & FVG scanner with alerts, zone merging, and HTF confluence.

You may also like

Indicator
BOS
Add standard-timeframe context candles to a native Renko chart.
Indicator
Risk Dashboard
AI-powered daily range forecasts help traders spot volatility opportunities and plan stops and targets.
Indicator
Forex
BTCUSD
+11
πŸ“ˆ Adaptive ALMA-Gaussian hybrid trend filter with precision smoothing and clear buy/sell signals.
Indicator
Key Levels
Market Structure
+1
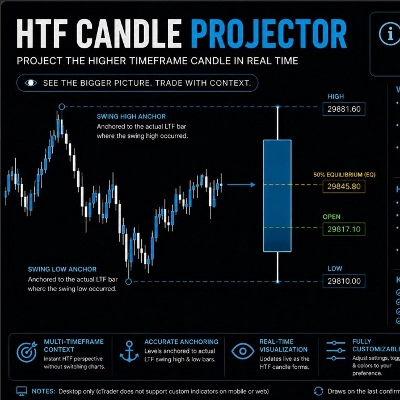
HTF Candle Projector displays the current Higher Timeframe candle (4H or 1H) as a real projected candle LIVE..
"ATR Bands" logo
Popular
4.7
(4)
$19
Indicator
ATR
Prop
+13
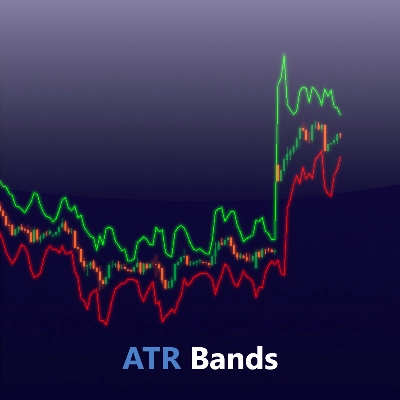
Enhance trading with ATR Bands! Visualize market volatility using dynamic upper and lower ATR bands for precise decision
Indicator
RSI
XAUUSD
+2
Automatic ZigZag swings with dynamic support & resistance levels, labeling highs/lows for clear trend signals.
Indicator
Crypto
EURUSD
+5
MultiTimeframe MA
Indicator
Volume
Liquidity Sweep
+1
Liquidity Profiler Tools
Indicator
ATR
Forex
+5
πŸš€ Buy and sell signals πŸ“ˆπŸ“‰ only when three independent engines agree simultaneously.
Indicator
RSI
RSI on the main chart with 45/55 momentum levels, overbought/oversold levels, averaged RSI, and multi-timeframe support.
Indicator
AI
Grid
+9
Pivot Point MultiTimeFrame with Order Block
Indicator
Prop
Forex
+13
Volume Meter
Indicator
SMC
Prop
+16
πŸ“Š VWAP with MTF & Dynamic Deviation Bands
Indicator
AI
RSI
+18
Session boxes with UTC offset, OR logic, adjustable opacity, and multi-day lookback.
Indicator
ADX
ATR
+2
GOLD SENTINEL v1.0 - A CANDLE-COLORING INDICATOR FOR GOLD.
Indicator
Volume
Key Levels
+4
Session & Kill Zone Highlighter - Visual tool for London, NY, Tokyo, Sydney sessions plus ICT Kill Zones.
Indicator
ATR
RSI
+1
Super Trend Rsi ,ATR + trend change distance + dynamic Alpha, divergence/convergence
Indicator
Forex
BTCUSD
+7
πŸš€ TMAX RBA Indicator - The Ultimate Multi-Timeframe Momentum System πŸš€

Price

54
Sales
4.97K
Free installs