
SwingHighLowDetector
Indicador
1 compras
Versión 2.2, Jan 2026
Windows, Mac
4.8
Valoraciones: 5
Desde 13/03/2025
1
Ventas
Descripción
Este es un indicador de alta precisión para encontrar oscilaciones.
El usuario puede personalizar este indicador para enviar alertas así como ventanas emergentes en sus gráficos y otros dispositivos.
Forma de uso:
- Adjunte el indicador al gráfico.
- Calculará las oscilaciones pasadas y las mostrará en pantalla
- Personalice los parámetros según su preferencia respecto al máximo de registros pasados a rastrear.
- Para crear una alerta, active la opción "Alert Allowed" para enviar alertas dinámicamente a sus dispositivos cuando se formen y activen oscilaciones.
- Otra función detectará si el precio ha cruzado las oscilaciones y eliminará ese indicador del análisis. (Active el parámetro "Remove Swept levels")
- Finalmente, personalice el parámetro "Past Swing Days Alerts" para recibir alertas de todas las oscilaciones generadas en los últimos N días.
¿Por qué comprar este indicador?
- Para reducir el análisis de oscilaciones en diferentes mercados.
- Con la ayuda de nuestro indicador, puede visualizar claramente las oscilaciones y recibir alertas en su dispositivo, lo que le ahorrará una gran cantidad de tiempo.
Detalles gráficos generales:
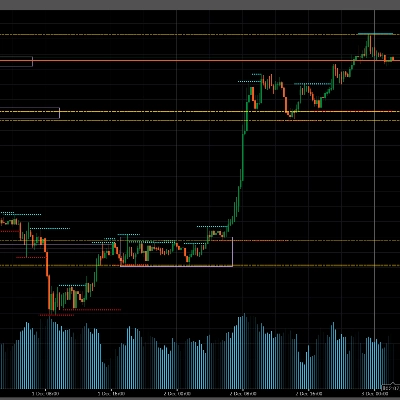
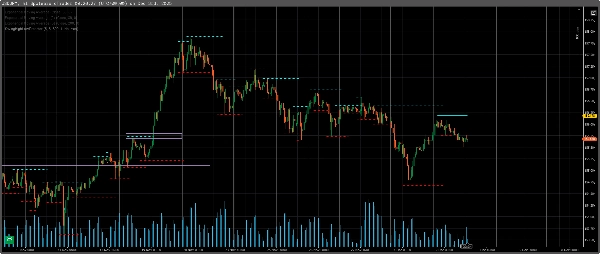
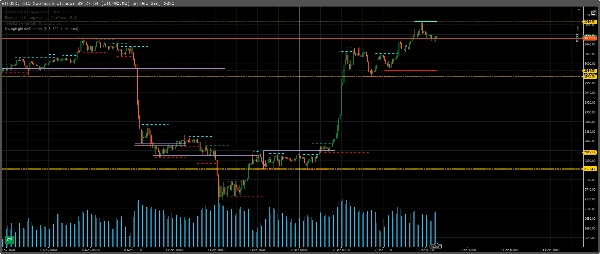
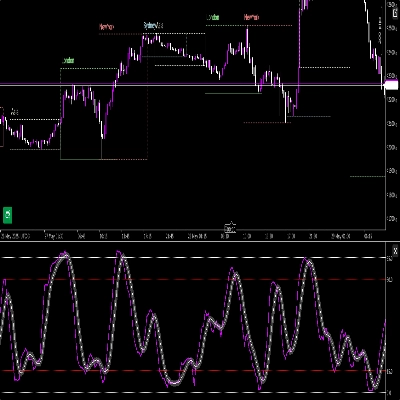
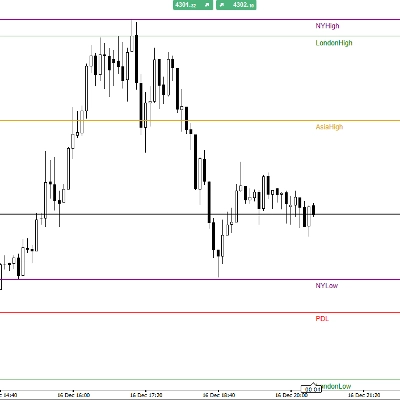
- Las líneas punteadas azul aqua son los máximos de oscilaciones pasadas
- La línea azul punteada sólida es el último máximo de oscilación
- Las líneas rojas punteadas son los mínimos de oscilaciones pasadas
- La línea roja punteada sólida es el último mínimo de oscilación
Resumen
Resumen de IA
SwingHighLowDetector is a high-accuracy multi-timeframe indicator designed to identify swing highs and lows on trading charts. It calculates and visually displays past and latest swing points using distinct colored lines: dotted aqua blue for past swing highs, solid dotted blue for the latest swing high, dotted red for past swing lows, and solid dotted red for the latest swing low. Users can customize parameters such as the number of past swing records to track and enable alerts that send notifications to devices when new swings form or are triggered. The indicator also includes a feature to remove swings from analysis once the price crosses them, enhancing chart clarity. It supports various markets and symbols including Forex pairs (EURUSD, GBPUSD, NZDUSD, USDJPY), cryptocurrencies (BTCUSD), commodities (XAUUSD), indices (NAS100), and stocks. The tool aims to streamline swing analysis across different markets by providing clear visualization and timely alerts, helping traders save time in monitoring price action.
Perfil del indicador
Conversación
Valoraciones de clientes
4.8
Valoraciones: 5
5 | 80 % | |
4 | 20 % | |
3 | 0 % | |
2 | 0 % | |
1 | 0 % |
Valoraciones de clientes
December 16, 2025
December 14, 2025
A calm trader gets value from the idea has to earn the click. Overconfidence is the real danger.
December 10, 2025
it deserves attention when the log becomes easier to read, and two sessions say more than one clean chart.
December 4, 2025
Preguntas frecuentes
BTCUSD
Forex
Breakout
Indices
EURUSD
Commodities
GBPUSD
NZDUSD
Prop
Crypto
Stocks
XAUUSD
NAS100
USDJPY
Los productos disponibles a través de cTrader Store, incluidos bots, indicadores y plugins para operar, son proporcionados por desarrolladores de terceros y están disponibles únicamente con fines informativos y de acceso técnico. cTrader Store no es un bróker, por lo que no proporciona asesoramiento de inversión, recomendaciones personales ni ninguna garantía de rentabilidad futura.











Precio
Desde 13/03/2025
1
Ventas