

Penerangan
Apa yang diperhatikan
Ini tidak diambil dari sumbu atau penutupan. Untuk setiap bar, ia membina profil volum sebenar menggunakan tetingkap 5-bar bergulung, membahagikan julat harga kepada 200 baldi, dan mencari di mana volum paling banyak sebenarnya diperdagangkan — itulah tahap yang digunakannya. Kemudian ia mengimbas siri itu untuk ayunan tinggi dan rendah menggunakan dua kelajuan pandangan ke belakang: satu pantas untuk pivot terkini, dan satu lagi lebih perlahan dan luas untuk yang lebih mantap.
Cara membacanya
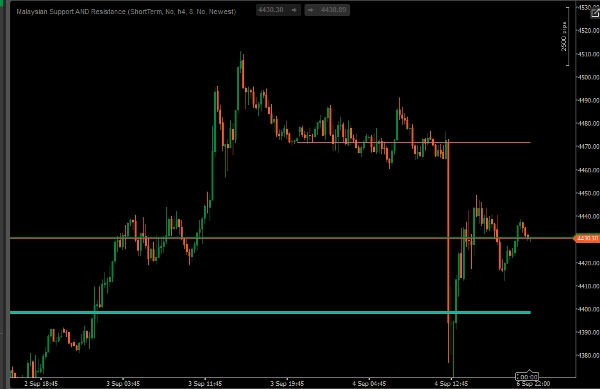
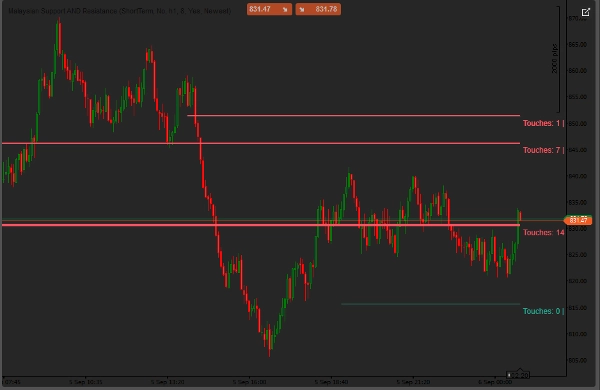
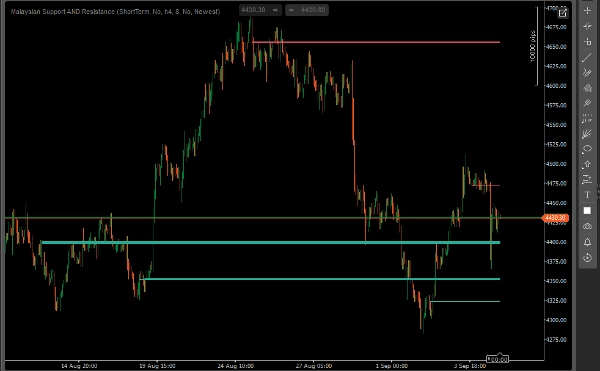
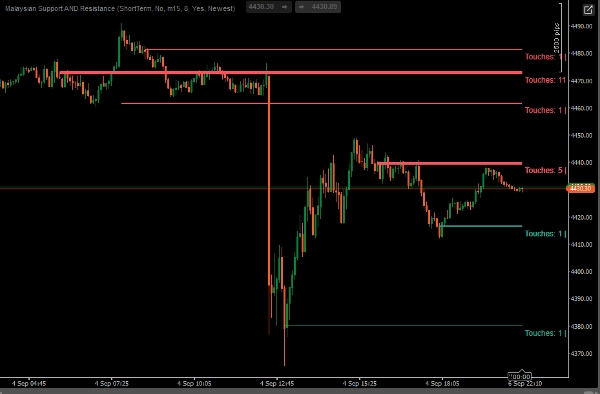
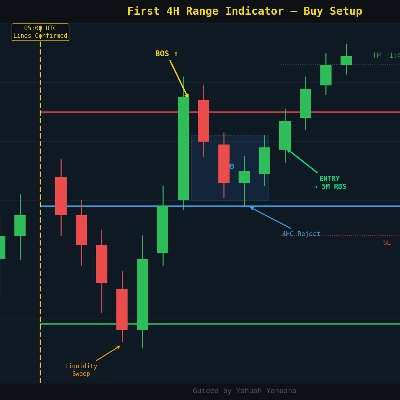
Setiap garis adalah tahap sokongan atau rintangan. Warna menunjukkan sama ada harga semasa berada di atasnya (sokongan) atau di bawahnya (rintangan). Ketebalan menunjukkan betapa pentingnya ia — berapa kali harga telah menyentuhnya dan berapa banyak volum yang diperdagangkan berhampirannya. Hidupkan "Tunjukkan Sentuhan | Kiraan Volum" dan gerakkan kursor ke atas garis untuk melihat nombor tepat. Anda akan melihat sehingga 8 tahap sekaligus: tinggi/rendah yang baru terbentuk dengan cepat, ditambah 3 tinggi yang lebih mantap dan 3 rendah yang lebih mantap.
Tetapan utama
- Pandangan Pasaran — Jangka Pendek / Standard / Jangka Panjang, mengawal sejauh mana ia melihat ke belakang untuk pivot
- Gunakan Jangka Masa Carta atau Jangka Masa Lebih Tinggi tertentu
- Bilangan Garis untuk Ditunjukkan — 1 hingga 8
- Pilih Tahap Mengikut — Terbaru (3 terkini) atau Terkuat (3 paling banyak disentuh/volum tertinggi, tanpa mengira umur)
- Tunjukkan Sentuhan | Kiraan Volum — menambah nombor pada setiap garis
- Warna Sokongan/Rintangan — boleh disesuaikan sepenuhnya
Untuk siapa ia
Pedagang yang menggunakan aksi harga, SMC, atau konsep gaya ICT yang mahukan sokongan/rintangan objektif dan bukannya melukisnya secara manual. Berfungsi terbaik sebagai lapisan konfluens bersama struktur dan bacaan kecairan anda sendiri, bukan sebagai isyarat berdiri sendiri.
Perlu diketahui
- Tahap hanya disahkan setelah cukup bar berlalu untuk membuktikannya — harga terkini tidak akan menggerakkan tahap yang sudah disahkan
- Volum adalah volum tik, standard untuk forex/CFD/sintetik — bukan volum yang diperdagangkan di bursa
- Berikan ia sedikit sejarah untuk bekerja. Pada instrumen yang baru disenaraikan atau sunyi anda mungkin melihat kurang daripada 8 tahap pada mulanya, yang akan diisi apabila lebih banyak pivot disahkan
Ringkasan
Displayed lines represent support or resistance, with color indicating whether the current price is above (support) or below (resistance) the level. Line thickness reflects importance based on the frequency of price touches and volume traded near the level. Users can view up to eight levels simultaneously, including the newest fast-forming pivots and multiple established highs and lows. Additional features include customizable settings for market view (short to long term), timeframe selection, number of lines shown, level selection criteria (newest or strongest), and display of touch and volume counts.
This indicator is designed for traders employing price action, Smart Money Concepts (SMC), or ICT-style methods who prefer objective support and resistance levels derived from volume data rather than manual drawing. It functions best as a complementary tool alongside other structural and liquidity analyses. The volume data used is tick volume, standard for forex, CFDs, and synthetic instruments.














![Logo "Gaussian Channel [Iridio Capital]"](https://cdn.ctrader.com/image/webp/2c4f9ca9-4e9b-476d-b5a6-787c8095032b_61546)


