Описание
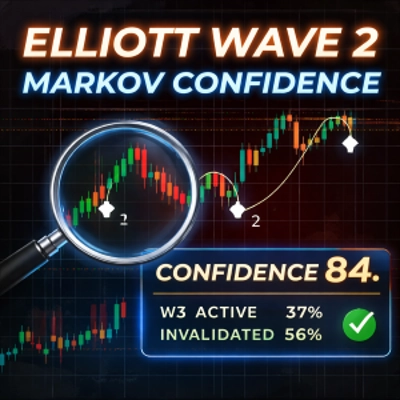
Elliott CLEAN — Wave2 + Марковская уверенность
Elliott CLEAN — это продвинутый аналитический индикатор, предназначенный для помощи трейдерам в идентификации, валидации и управлении установками Elliott Wave 2 с использованием комбинации структуры рынка и статистической вероятности.
Вместо предсказания направления цены, индикатор фокусируется на структурных переходах и отвечает на более полезный вопрос:
Насколько вероятно, что Волна 2 разовьётся в валидную и устойчивую Волну 3 — и насколько трейдер может быть уверен в этом сценарии?
Что делает этот индикатор
Elliott CLEAN автоматически:
- Обнаруживает структуры Волна 1–Волна 2 на основе поворотных точек
- Определяет триггер, стоп-лосс, уровни аннулирования и цели Волны 3
- Отслеживает исторические структурные исходы с помощью 5-состояний Марковской модели
- Вычисляет условные вероятности для:
-
- Активации Волны 3
- Аннулирования установки
- Раннего истощения Волны 3
- Преобразует эти вероятности в единый показатель уверенности (0–100)
Это позволяет трейдерам фильтровать низкокачественные установки, избегать чрезмерной торговли и входить в сделки только тогда, когда структура и статистика совпадают.
Основные функции
- ✅ Автоматическое обнаружение Elliott Wave 2
- ✅ Несколько режимов подтверждения (Break+Hold, Break, Reclaim, Wick)
- ✅ Чёткие уровни триггера, стоп-лосса, аннулирования и прогнозируемые цели
- ✅ Марковский движок вероятностей с 5 состояниями (основан на событиях/свингах, а не на барах)
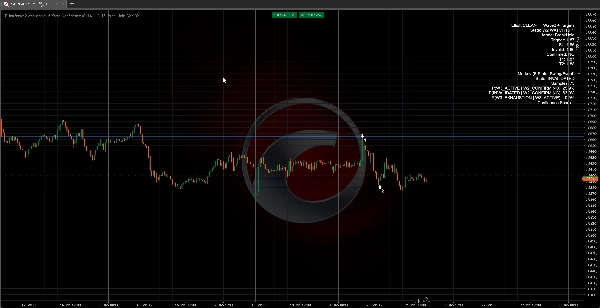
- ✅ Отображение условных вероятностей в реальном времени на графике
- ✅ Единый показатель уверенности (0–100) для поддержки принятия решений
- ✅ Чистый, ненавязчивый дизайн HUD
- ✅ Работает с любым символом и любым таймфреймом
Показатель уверенности (важно)
Показатель уверенности не является коэффициентом выигрыша и не является сигналом.
Это контекстный показатель качества, основанный на исторических структурных переходах:
- Во время Волны 2 показатель отражает:
-
- Вероятность начала Волны 3
- С учётом вероятности раннего провала
- Во время Волны 3 показатель отражает:
-
- Историческую вероятность того, что Волна 3 продолжится без раннего истощения
На практике:
- Низкие показатели = структура слабая или ненадёжная
- Высокие показатели = структура редкая, но статистически надёжная
Это помогает трейдерам решать, когда быть осторожным, а когда позволить сделке работать.
Типичные случаи использования
- ✔ Фильтрация установок Elliott Wave перед входом
- ✔ Избежание маргинальных или низкокачественных сделок Волны 2
- ✔ Корректировка размера позиции на основе уверенности
- ✔ Управление сделками Волны 3 с меньшим эмоциональным вмешательством
- ✔ Поддержка дискреционной торговли с объективными структурными данными
Индикатор особенно полезен для трейдеров, которые уже понимают теорию Elliott Wave и хотят количественное подтверждение без автоматизации.
Как использовать (базовый рабочий процесс)
- Подключите индикатор к графику
- Выберите предпочитаемый режим подтверждения
- Дождитесь валидной структуры Волны 2
- Наблюдайте:
-
- Триггер, стоп-лосс, аннулирование
- Марковские вероятности
- Показатель уверенности
- Решите, стоит ли торговать установку на основе структуры + уверенности
Важные заметки и отказ от ответственности
- Этот индикатор аналитический, а не предсказательный
- Он не генерирует сигналы на покупку/продажу
- Прошлая структурная статистика не гарантирует будущих результатов
- Торговля связана с риском; пользователи полностью ответственны за свои решения
Индикатор предназначен как инструмент поддержки принятия решений для дискреционных трейдеров.
Для кого этот индикатор
- Трейдеры, знакомые с концепциями Elliott Wave
- Дискреционные трейдеры, которые ценят структуру выше индикаторов
- Трейдеры, ищущие объективные фильтры, а не автоматические системы
- Пользователи, которые хотят контекст вероятности, а не метки задним числом
_______________________
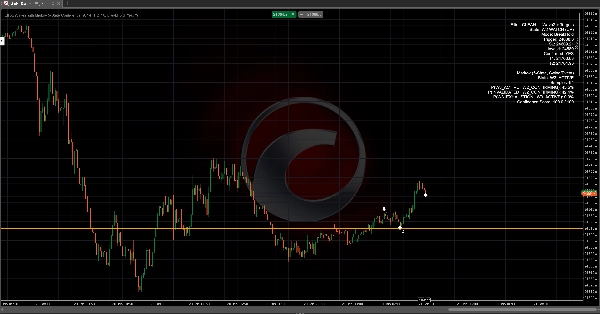
HUD и состояния
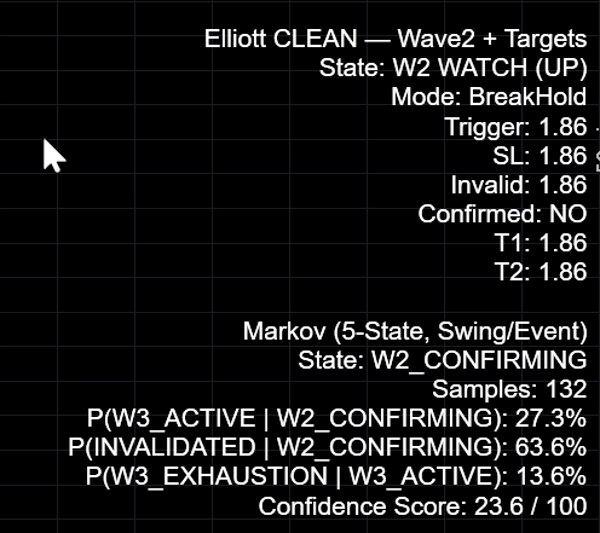
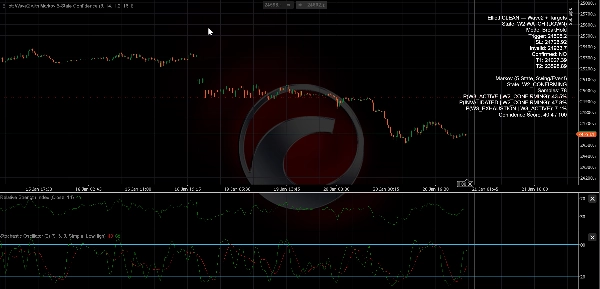
Индикатор выводит уровни структуры и марковские вероятности прямо на график.
Основной слой Elliott:
- Состояние: W2 WATCH (ВВЕРХ/ВНИЗ) — потенциальная Волна 2 присутствует (структура найдена)
- Подтверждено: ДА/НЕТ — выбранное вами правило подтверждения сработало
- Триггер — цена уровня должна пробить/вернуть (зависит от режима)
- SL — предложенный защитный уровень стопа (зависит от режима SL)
- Аннулирование — уровень структурного аннулирования (начало Волны 1)
- T1/T2 — проекции Волны 3 с использованием множителей
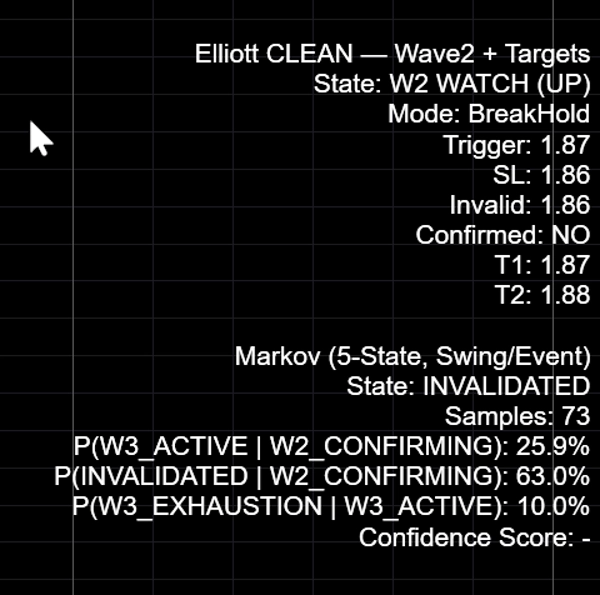
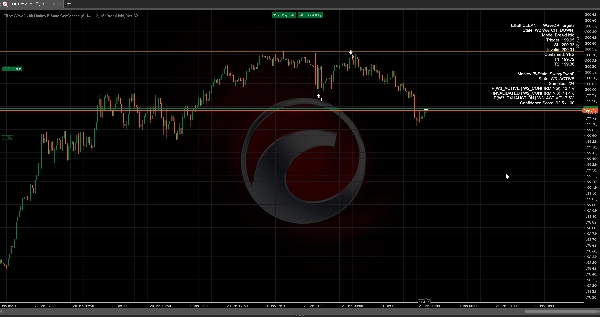
Марковский слой:
- Состояние — текущее марковское состояние (например,
W2_CONFIRMING,W3_ACTIVE,INVALIDATED) - Образцы — исторический счётчик, используемый для вероятностей
- P(W3_ACTIVE | W2_CONFIRMING) — вероятность активации Волны 3 из фазы Волны 2
- P(INVALIDATED | W2_CONFIRMING) — вероятность провала установки во время фазы Волны 2
- P(W3_EXHAUSTION | W3_ACTIVE) — вероятность раннего провала Волны 3 после активации
Показатель уверенности (0–100)
Показатель уверенности не является коэффициентом выигрыша и не гарантирует результат. Это показатель качества, основанный на исторических структурных переходах.
Как используется показатель:
- Во время
W2_CONFIRMINGпоказатель отражает «вероятность активации», скорректированную с учётом риска раннего провала. - Во время
W3_ACTIVEпоказатель отражает «надёжность продолжения» (низкий риск раннего истощения).
Всегда интерпретируйте показатель вместе с: (1) ясностью структуры, (2) расстоянием до аннулирования и (3) размером выборки.
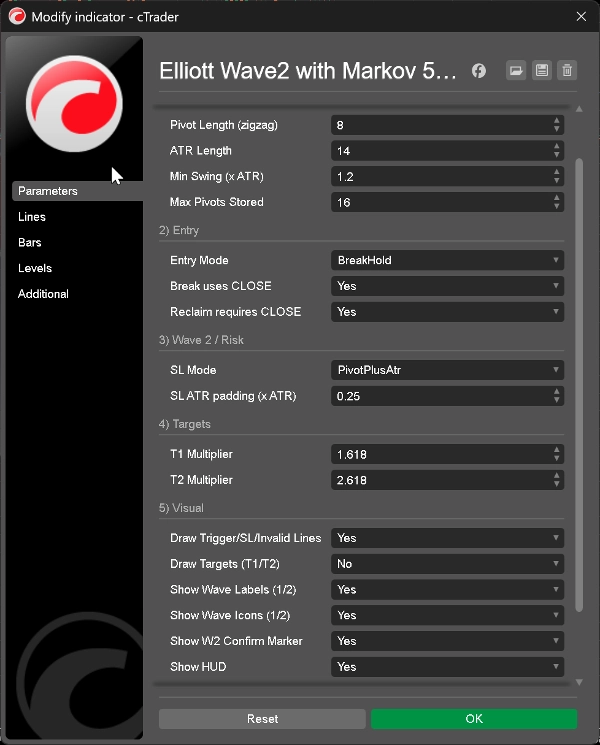
Входные параметры (что они делают)
1) Пивот / Структура
- Длина пивота (зигзаг): Управляет чувствительностью свингов. Чем выше — тем меньше свингов, чище структура.
- Длина ATR: Окно ATR, используемое для фильтрации свингов и дополнительной подкладки SL.
- Мин. свинг (×ATR): Минимальный размер свинга для принятия пивота (фильтрует шум).
- Макс. сохранённых пивотов: Ограничивает историю свингов (производительность и стабильность).
2) Вход
- Режим входа: Выберите стиль подтверждения:
-
BreakHold— безопаснее: пробой, затем удержание выше триггераBreak— быстрее: однократный пробой триггераReclaim— поведение «свип + возврат»Wick— агрессивно: фитиль через триггер
- Break использует CLOSE: Использует закрытие вместо фитиля для логики пробоя (рекомендуется).
- Reclaim требует CLOSE: Требуется закрытие с правильной стороны после свипа.
3) Волна 2 / Риск
- Режим SL: Определяет базовую точку размещения стопа.
- Подкладка SL ATR (×ATR): Дополнительный буфер при использовании стопа на основе ATR.
4) Цели
5) Визуализация
- Отображать линии триггера/SL/аннулирования: Показывать/скрывать основные горизонтальные уровни.
- Отображать цели: Опциональные линии целей (менее «чистые»).
- Показывать метки/иконки волн: Отображать маркеры волн (1/2).
- Показывать маркер подтверждения W2: Показывает маркер подтверждения.
- Показывать HUD: Показывать/скрывать весь HUD.
Как использовать:
- Сканируйте несколько рынков, затем сосредоточьтесь только на более качественных структурных условиях.
- Используйте показатель + размер выборки, чтобы решить, стоит ли установка времени и риска.
Часто задаваемые вопросы
Работает ли это на всех символах и таймфреймах?
Да. Это подход, основанный на структуре. Результаты и вероятности будут варьироваться в зависимости от поведения рынка и волатильности.
Является ли показатель уверенности коэффициентом выигрыша?
Нет. Это показатель качества структуры, основанный на исторических переходах состояний (Марковская модель). Он не гарантирует результатов.
Почему показатель часто низкий во время Волны 2?
Потому что активация Волны 3 избирательна. Многие кандидаты на Волну 2 терпят неудачу или колеблются. Индикатор предназначен для фильтрации таких случаев.
Что насчёт малого размера выборки?
Рассматривайте вероятности как менее стабильные при малом размере выборки. Используйте показатель как контекст, а не как уверенность.
Отказ от ответственности по рискам
Торговля связана с риском и может быть не подходящей для всех инвесторов. Прошлая производительность и историческая вероятность не гарантируют будущих результатов. Этот индикатор предоставляет только аналитическую информацию и не является инвестиционной рекомендацией или советом покупать или продавать какой-либо инструмент. Вы несёте ответственность за свои решения, управление рисками и соблюдение местных нормативов.
Elliott Wave, структура рынка, технический анализ, вероятность, статистический анализ, свинг-трейдинг, управление рисками, поддержка принятия решений
Сводка
Отзывы покупателей
5 | 100 % | |
4 | 0 % | |
3 | 0 % | |
2 | 0 % | |
1 | 0 % |


