Beschreibung
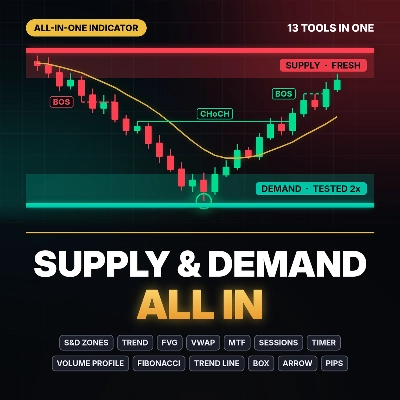
Supply & Demand All In brings 13 trading tools together in one compact button panel. Instead of loading several indicators, you switch each tool on or off with one click, and your choices are remembered across charts and timeframes.
What the indicator analyses
- Price structure from closed candles: swing highs and lows, Break of Structure (BOS) and Change of Character (CHoCH)
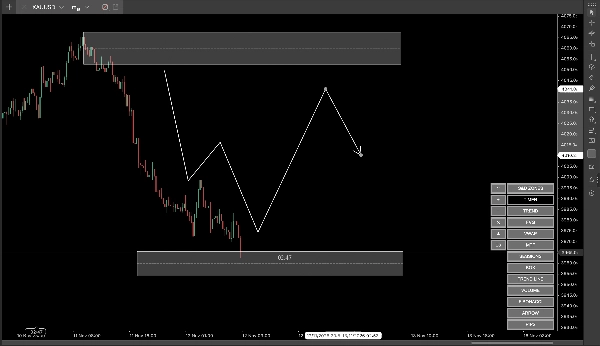
- Supply and demand zones created at the origin of each structure break
- Previous day high and low (PDH / PDL)
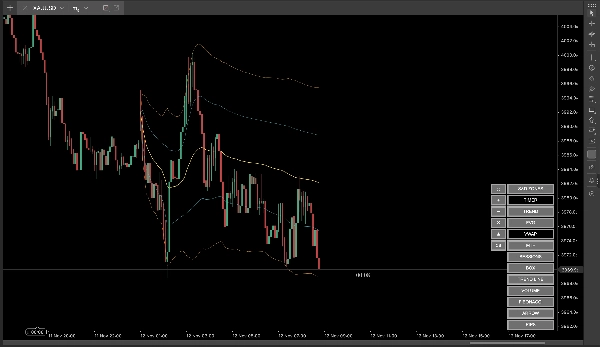
- Session-anchored VWAP with standard deviation bands
- Fair Value Gaps (three-candle imbalances)
- Candle direction and estimated buying/selling pressure across five timeframes
- Tick volume, for the volume profile and VWAP
How to read the signals
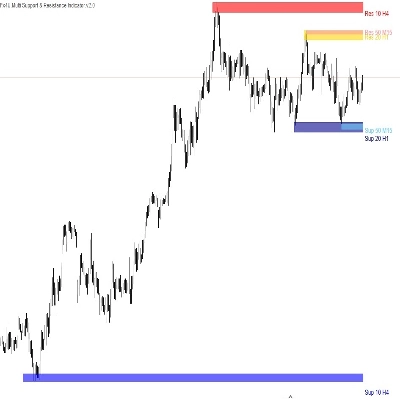
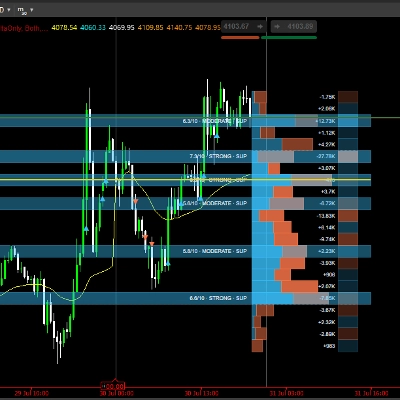
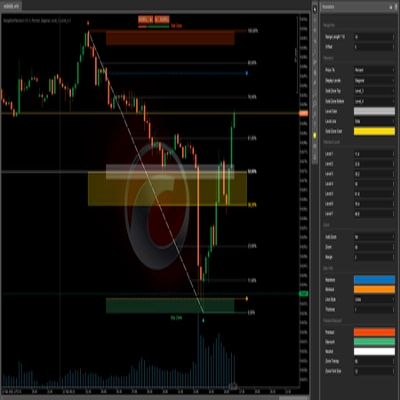
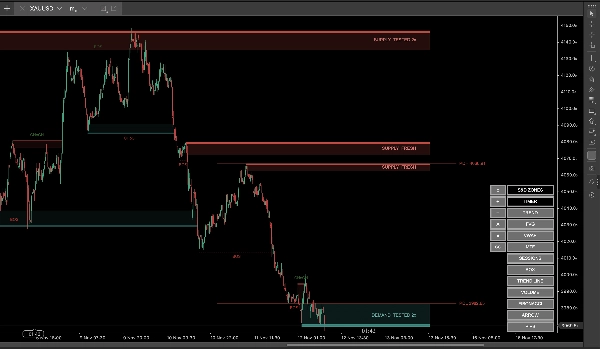
- S&D ZONES: Red boxes are supply and teal boxes are demand. Each zone shows how many times price has returned to it: FRESH means never tested, TESTED 2x means price came back twice. A zone fades when a candle closes through it.
- BOS / CHoCH: A dotted line marks a BOS, meaning the trend continues. A solid line marks a CHoCH, meaning the protected level broke and the trend may be changing. Structure is calculated only on closed candles, so it does not repaint.
- PDH / PDL: Yesterday’s high and low, drawn as lines with price labels.
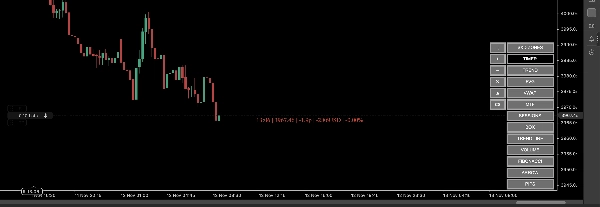
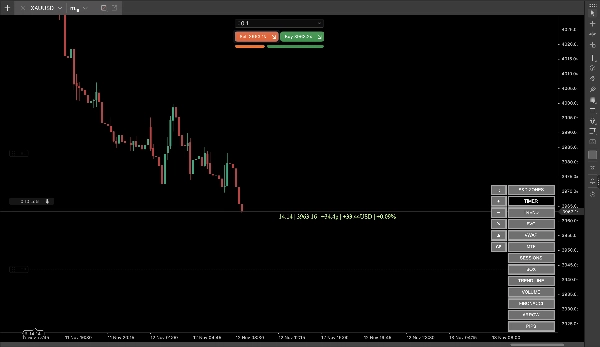
- TIMER: A countdown to the candle close. When you have an open position, it also shows its profit or loss in your account currency.
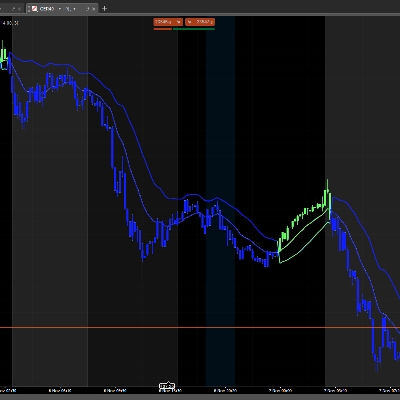
- TREND: A SuperTrend line based on ATR, with an optional background cloud.
- FVG: Bullish and bearish gaps that are removed once a candle closes through them.
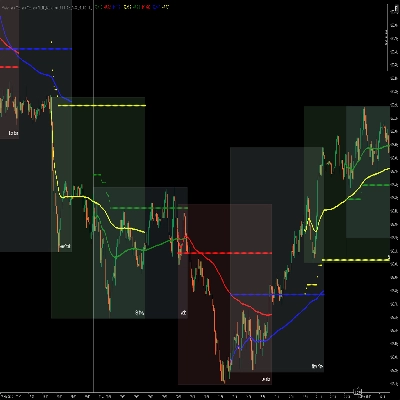
- VWAP: Resets every day at the session start (default 01:00, ending 00:00, chart time) and offers up to three bands.
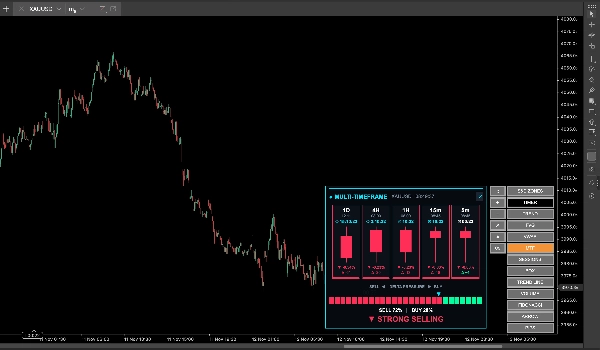
- MTF: A card showing the running candle, countdown and % change for five timeframes, plus a buy/sell pressure meter.
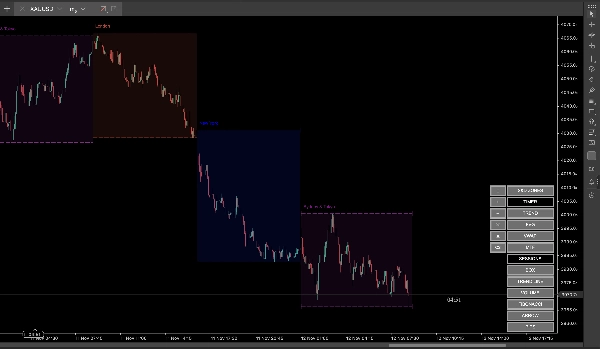
- SESSIONS: Tokyo, London and New York high/low boxes.
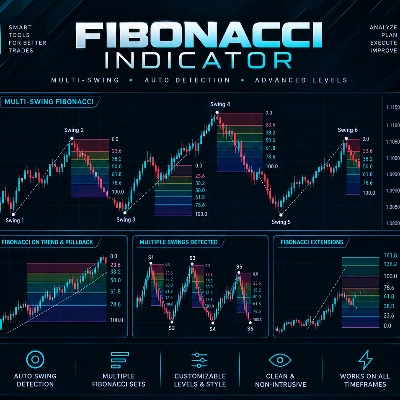
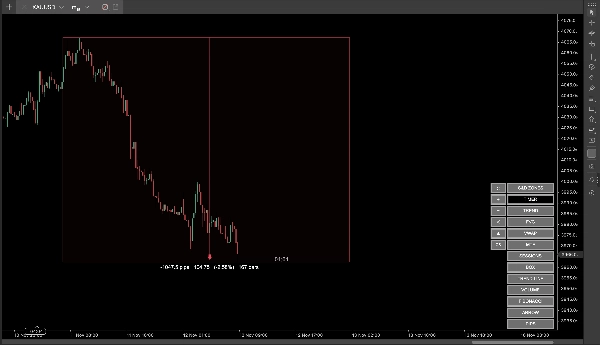
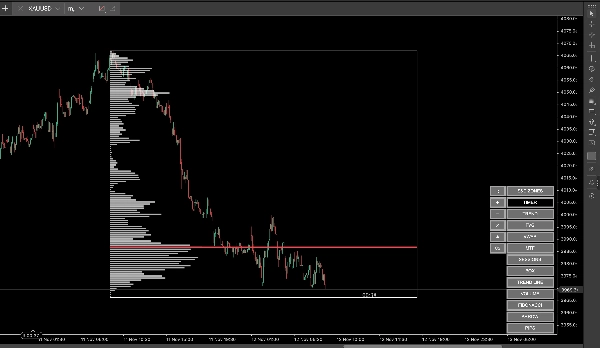
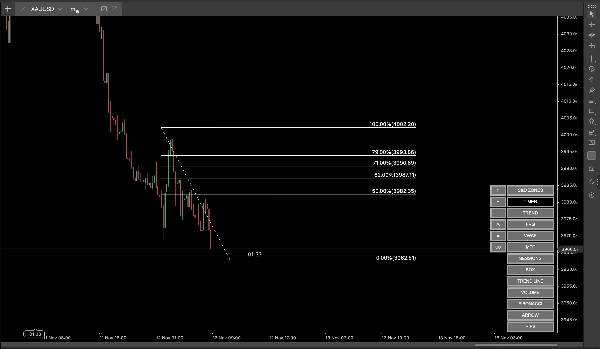
- Drawing tools: BOX, TREND LINE, FIBONACCI (your own levels), ARROW (multi-point path), PIPS (distance in pips, price, % and bars) and VOLUME (fixed range volume profile with POC). A crosshair with price and time labels appears while you draw.
Key settings
Every tool has its own settings group: colours, line styles, zone count, swing length, test sensitivity, ATR period and multiplier, VWAP session times and bands, MTF timeframes, session times, Fibonacci levels and more. The panel can be moved, resized with + / −, or collapsed into a small button that docks in the bottom right corner.
Typical use cases
- Wait for price to reach a FRESH demand or supply zone, then look for a CHoCH on a lower timeframe as confirmation
- Use PDH / PDL and VWAP as targets or as extra confluence with a zone
- Check the MTF card to see whether higher timeframes agree with your trade idea
- Measure risk and reward quickly with the PIPS tool
Who it is for
Intraday and swing traders who trade supply & demand, Smart Money Concepts or price action on forex, gold, indices and other cTrader symbols. It is easy for beginners and fully configurable for experienced traders.
Limitations and notes
- Volume is cTrader tick volume, not exchange volume
- The buy/sell pressure in the MTF card is an estimate based on candle shape and tick volume, not real order flow
- VWAP is shown on timeframes below Daily
- Zones and structure depend on the swing length you choose; different settings give different zones
- The indicator does not place trades or send trade signals
Disclaimer
This indicator is a technical analysis tool for educational purposes only and is not investment advice. It does not guarantee profits or any particular result. Past performance does not guarantee future results. Trading forex, CFDs and other leveraged products carries a high risk of loss, and you can lose more than your initial investment. Always use proper risk management and trade only with money you can afford to lose.