present
Daftar dan dapatkan diskon $50 untuk pembelian pertama Anda
Trading product for Pivot Levels Indikator Fibonacci Fair Value Gap, image 1
Pivot Levels
Indikator
Versi 1.1, Nov 2026
Windows, Mac
Trading product for Pivot Levels Indikator Fibonacci Fair Value Gap, image 2
1
Instal gratis

Deskripsi

Pivot Levels: sessions, previous day and week, ORB, Floor Pivot and Camarilla

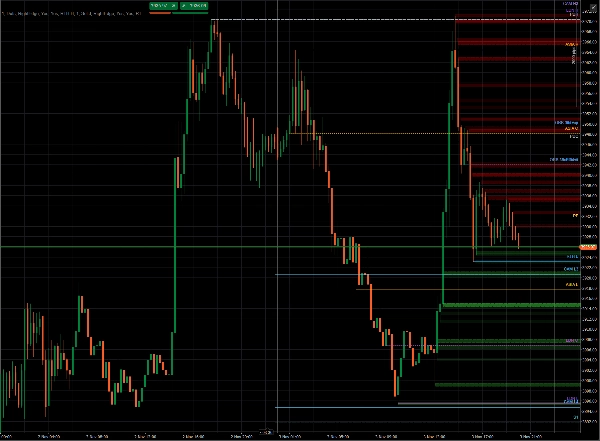
Pivot Levels puts the price levels that traders watch every day on your chart, drawn as clean rays with labels, and adds a compact table with the range of each session. It is a display-only study: it places no orders and changes nothing on your account.

What it draws

  • Today's sessions: Open, High and Low of the RTH session (09:30–16:00 New York), the Asian session (Tokyo) and the London session. Session times follow their own time zones, so daylight saving is handled for you, and you don't type any hours
  • Yesterday: Open, High, Low and Close of the previous trading day
  • Previous week: Open, High, Low and Close of the previous week.
  • Opening Range Breakout (ORB): the high ("up") and low ("down") reached in the first 15 and 30 minutes of the RTH session. Draw them only once the range has formed, or in real time while it forms
  • Floor Pivot: PP, R1, R2, S1, S2, calculated from the previous trading day
  • Camarilla: H3, H4, H5, L3, L4, L5, calculated from the previous trading day

Each line starts where its value was formed (the time of the high, the low or the open), so you can see when a level was set. Current levels extend to the right as rays. Past days can optionally be shown for review.


Session Range Monitor

A small table shows, for each session of the current trading day, its range in points and pips and an arrow for the direction of the session. The live session is highlighted. You choose the corner, the offsets and the font size.


Trading day without setup

By default the trading day is taken from your broker's own Daily bars, so rollover and daylight saving are the real ones for your server and nothing needs to be configured.

Alternatively you can use a fixed 17:00 New York day, identical across brokers. You can also compute yesterday, weekly and pivot levels on the full session or on RTH only.


Customization

  • Every level has its own switch, label, line width, line style, color (with the native color picker), label side and optional price value
  • Label position: left, right (follows the last bar), or anchored to the right or left edge of the chart, next to the Y axis, even while you scroll or zoom
  • A general switch to show labels only, or labels with values, and a label font size
  • History loads in the background, so the chart stays responsive. The data timeframe is chosen automatically from your chart and can be changed


Good to know

  • Works on any symbol and chart timeframe supported by your CFD broker's data since all levels are derived from price only
  • Levels are calculated from the data your broker provides, so values can differ slightly between brokers
  • This is an analysis tool, not trading advice. Past levels do not guarantee future price behavior



Ringkasan

Profil indikator
Kategori indikator
Support & resistance
Tipe output
Visualisasi
Persyaratan data
Hanya batang
Sinyal yang didukung
Breakout
Reversal
Kekuatan tren
Volatilitas
Level tersentuh
Level tertembus
Rentang sesi pembukaan
Divergen
Cross

Diskusi

Ulasan pelanggan

0.0
Ulasan: 0
Ulasan pelanggan
Belum ada ulasan untuk produk ini. Sudah mencobanya? Jadilah pemberi ulasan pertama!

Pertanyaan umum

Fibonacci
Fair Value Gap
Key Levels
Order Block
Market Structure
Supply & Demand
Support & Resistance
Produk-produk yang tersedia melalui cTrader Store, termasuk bot trading, indikator, dan plugin, disediakan oleh pengembang pihak ketiga serta hanya ditujukan untuk akses teknis dan informasi. cTrader Store bukan broker dan tidak menyediakan saran investasi, rekomendasi pribadi, atau jaminan apa pun tentang kinerja di masa mendatang.

Produk lain dari penulis ini

Indikator
Fibonacci
Key Levels
+5
Displays the swing level zones shared by Flex Renko Inverse on any timeframe chart. Requires Flex Renko Inverse
Logo "Flex Renko Inverse"
Peringkat teratas
4.2
(4)
$99
Indikator
Pin Bar
Order Block
+5
NEVER MISS A TREND & LET TRENDS RUN with Sierra Chart's Flex Renko Inverse, rebuilt for cTrader.

Anda mungkin juga suka

Indikator
VWAP
Support & Resistance
Trading.FC$_vwap Algo shows VWAP trends, dynamic support/resistance and deviation bands to spot potential trade entries.
Indikator
SMC
Forex
+15
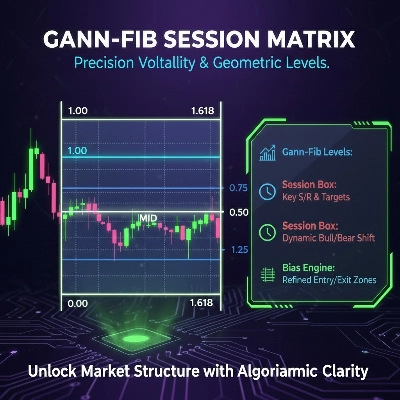
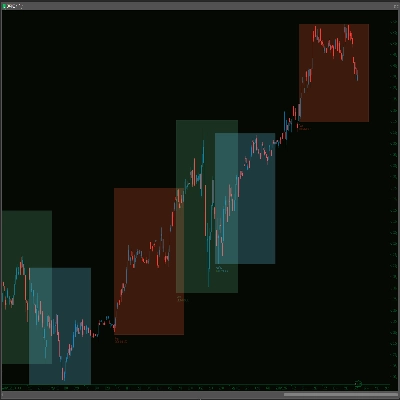
Session-based range tool projecting adaptive Gann & Fib levels with auto bias flip and extensions.
Indikator
Forex
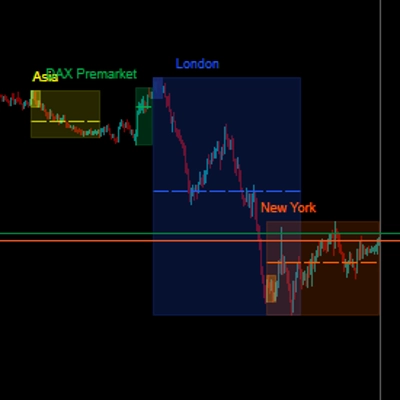
Version 3: Full control of session display including start and end times of all 3 sessions!
Indikator
Volume
Key Levels
+1
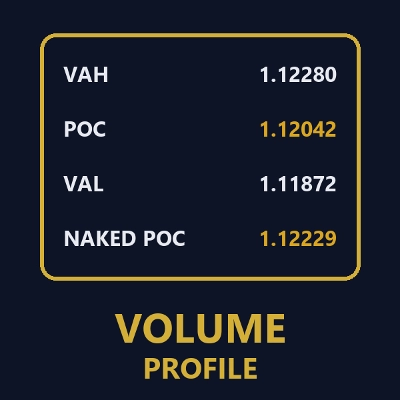
Session volume profiles from tick volume: POC, value area high and low, and naked POCs extended until touched.
Indikator
SMC
Forex
+5
Detects Break of Structure (BOS) and Change of Character (CHOCH)
Indikator
Volume
Imbalance
+1
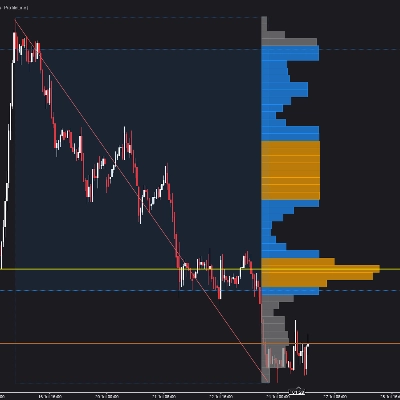
Volume profile indicator that auto-detects the latest trendline. Shows POC, Value Area (VAH/VAL), and High Volume Nodes
Indikator
ATR
Volume
+2
Nine timeframe cards, vivid candles, native BUY/SELL arrows and adjustable ATR-buffer stop-loss reference lines.
Indikator
EMA
RSI
+5
MACD Colour Histogram with 11 Moving Average Types, Multi-timeframe confirmation and Sound Signal Alert.
Indikator
ADX
ATR
+5
Precision Sniper by PrimeQuant: Advanced confluence engine with auto-presets, dynamic TP/SL, and live backtest stats.
Indikator
SMC
Prop
+11
Sessions PRO is a professional session visualization indicator - 4 Fully Customizable Sessions
Logo "CandleCounterAlex"
Peringkat teratas
4.7
(4)
$19
Indikator
CandleCounterAlex – Candle Cycle Counter with Colors and Adjustable Position.
Indikator
Key Levels
Liquidity Grab
+2
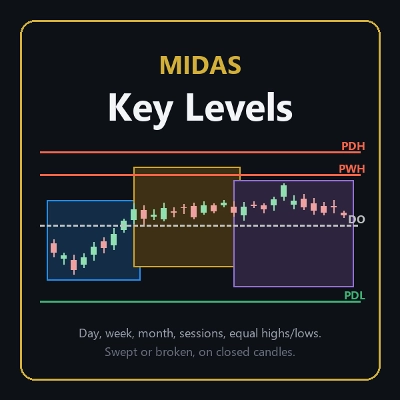
The levels you mark each morning, drawn and followed: PDH/PDL, weekly, monthly, sessions, equal highs/lows.
Indikator
ATR
SMC
+15
Plot ATR-based SL and 1R/2R/3R TPs instantly for any trade, with clear R-multiple risk mapping.
Indikator
EMA
RSI
+2
Advanced TDI indicator with Shark Fin signals, chart arrows, MTF RSI, divergence detection and smart alerts.
Logo "RSI Advanced"
Peringkat teratas
5.0
(4)
$20
/
$30
Indikator
AI
ATR
+12
The standard Relative Strength Index (RSI), RSI & Signal Cloud, Smart Volatility Filter (ATR), On-Chart Info Dashboard
Indikator
Advanced price action tool that combines multiple technical analysis concepts
Indikator
Forex
BTCUSD
+9
synchronize scroll position and zoom levels across multiple charts. Perfect for multi-timeframe analysis
Indikator
AI
Forex
+5
Dynamic, color‑coded candles reveal market shifts instantly—spot momentum and trend reversals at a glance

Harga

1
Instal gratis