present
Regístrese y obtenga 50 $ de descuento en su primera compra
Trading product for Pivot Levels Indicador Fibonacci Fair Value Gap, image 1
Pivot Levels
Indicador
Versión 1.1, Nov 2026
Windows, Mac
Trading product for Pivot Levels Indicador Fibonacci Fair Value Gap, image 2
1
Instalaciones gratis

Descripción

Pivot Levels: sessions, previous day and week, ORB, Floor Pivot and Camarilla

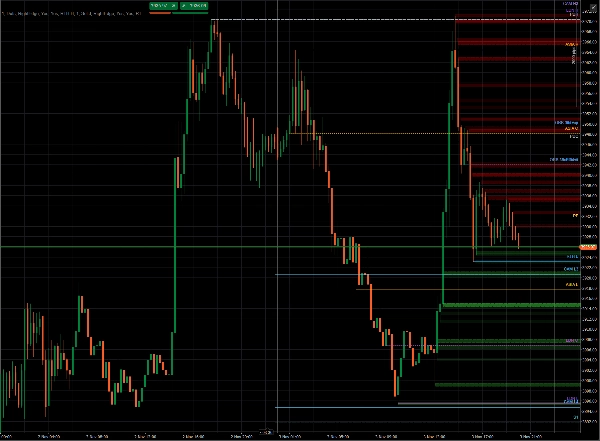
Pivot Levels puts the price levels that traders watch every day on your chart, drawn as clean rays with labels, and adds a compact table with the range of each session. It is a display-only study: it places no orders and changes nothing on your account.

What it draws

  • Today's sessions: Open, High and Low of the RTH session (09:30–16:00 New York), the Asian session (Tokyo) and the London session. Session times follow their own time zones, so daylight saving is handled for you, and you don't type any hours
  • Yesterday: Open, High, Low and Close of the previous trading day
  • Previous week: Open, High, Low and Close of the previous week.
  • Opening Range Breakout (ORB): the high ("up") and low ("down") reached in the first 15 and 30 minutes of the RTH session. Draw them only once the range has formed, or in real time while it forms
  • Floor Pivot: PP, R1, R2, S1, S2, calculated from the previous trading day
  • Camarilla: H3, H4, H5, L3, L4, L5, calculated from the previous trading day

Each line starts where its value was formed (the time of the high, the low or the open), so you can see when a level was set. Current levels extend to the right as rays. Past days can optionally be shown for review.


Session Range Monitor

A small table shows, for each session of the current trading day, its range in points and pips and an arrow for the direction of the session. The live session is highlighted. You choose the corner, the offsets and the font size.


Trading day without setup

By default the trading day is taken from your broker's own Daily bars, so rollover and daylight saving are the real ones for your server and nothing needs to be configured.

Alternatively you can use a fixed 17:00 New York day, identical across brokers. You can also compute yesterday, weekly and pivot levels on the full session or on RTH only.


Customization

  • Every level has its own switch, label, line width, line style, color (with the native color picker), label side and optional price value
  • Label position: left, right (follows the last bar), or anchored to the right or left edge of the chart, next to the Y axis, even while you scroll or zoom
  • A general switch to show labels only, or labels with values, and a label font size
  • History loads in the background, so the chart stays responsive. The data timeframe is chosen automatically from your chart and can be changed


Good to know

  • Works on any symbol and chart timeframe supported by your CFD broker's data since all levels are derived from price only
  • Levels are calculated from the data your broker provides, so values can differ slightly between brokers
  • This is an analysis tool, not trading advice. Past levels do not guarantee future price behavior


Resumen

Perfil del indicador
Categoría del indicador
Soporte y resistencia
Tipo de resultado
Visualización
Requisitos de datos
Únicamente barras
Señales admitidas
Ruptura
Inversión
Fuerza de la tendencia
Volatilidad
Toque de nivel
Ruptura de nivel
Rango en la apertura de la sesión
Divergencia
Cruce

Conversación

Valoraciones de clientes

0.0
Valoraciones: 0
Valoraciones de clientes
Este producto todavía no se ha valorado. ¿Ya lo ha probado? Sea el primero en informar a otros.

Preguntas frecuentes

Fibonacci
Fair Value Gap
Key Levels
Order Block
Market Structure
Supply & Demand
Support & Resistance
Los productos disponibles a través de cTrader Store, incluidos bots, indicadores y plugins para operar, son proporcionados por desarrolladores de terceros y están disponibles únicamente con fines informativos y de acceso técnico. cTrader Store no es un bróker, por lo que no proporciona asesoramiento de inversión, recomendaciones personales ni ninguna garantía de rentabilidad futura.

Más de este autor

Indicador
Fibonacci
Key Levels
+5
Displays the swing level zones shared by Flex Renko Inverse on any timeframe chart. Requires Flex Renko Inverse
Indicador
Pin Bar
Order Block
+5
NEVER MISS A TREND & LET TRENDS RUN with Sierra Chart's Flex Renko Inverse, rebuilt for cTrader.

Puede interesarle

Indicador
Volume
Key Levels
+1
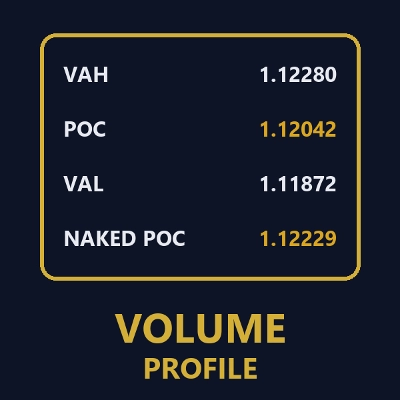
Session volume profiles from tick volume: POC, value area high and low, and naked POCs extended until touched.
Indicador
ATR
Volume
+3
Volume profile key levels - POC, value area, volume peaks and troughs - with break, rejection and retest signals
Logotipo de "supertrend"
Popular
4.3
(3)
$20
Indicador
ATR
Prop
+4
Supertrend Indicator
Indicador
Prop
Forex
+5
Transform your approach to trading with our innovative Pivot Point Indicator.
Indicador
EMA
RSI
+4
🚀📈 Plot buy/sell signals on Range Bars using Moving Averages and RSI. Clear, actionable trading insights.🚀📈
Indicador
Prop
Forex
+12
Half Trend Cloud
Indicador
ADX
ATR
+2
GOLD SENTINEL v1.0 - A CANDLE-COLORING INDICATOR FOR GOLD.
Indicador
ATR
Key Levels
+1
Explore 88 harmonic price-pattern variants with interactive chart controls and geometric reference levels.
Indicador
Forex
BTCUSD
+12
🎯Automatically identifies the market's significant turning points (key H & L) and draws dynamic support and.....✍️
Indicador
MACD
Signal
Enhance your trading strategy with our customizable TradingViewMACD indicator. Optimize and elevate your market analysis
Indicador
AI
ATR
+27
Supertrend Indicator
Indicador
ADX
ATR
+5
Precision Sniper by PrimeQuant: Advanced confluence engine with auto-presets, dynamic TP/SL, and live backtest stats.
Indicador
AI
RSI
+7
Multi-asset screener with real-time RSI/volatility analysis, interactive dashboard, and color-coded trading signals.
Indicador
ADX
ATR
+5
Ten confluence layers scored on every closed bar, with an anti-chop gate, pivot levels and a live dashboard.
Indicador
Prop
Forex
+12
A clean, real-time risk HUD designed to prevent prop firm account failure and protect your challenge account.
Indicador
ATR
SMC
+2
HTF POWER 3 ICT Power of 3 · M1 Precision · H4 Intelligence Auto-detect Accumulation → Manipulation → Distribution
Indicador
Supertrend
Moving Average
Easy Trade: Trend & Breakout Indicator for cTrader
Indicador
Signal
USDJPY
See USD demand in one line—Composite OBV fuses six major FX pairs into a clear momentum gauge.

Precio

1
Instalaciones gratis