
Descrição
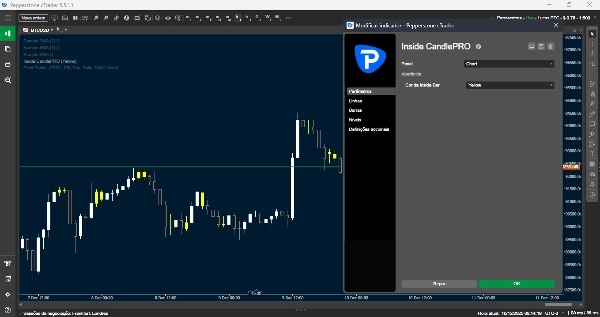
Inside Candle PRO - Detector Profissional de Padrão Inside Bar
Detecte automaticamente padrões Inside Bar com o Inside Candle PRO, um indicador técnico que identifica e destaca padrões de consolidação no seu gráfico.
O que é um Inside Bar?
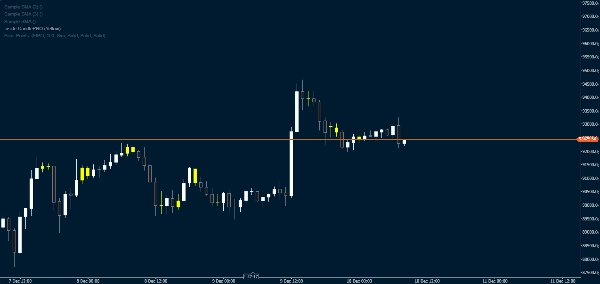
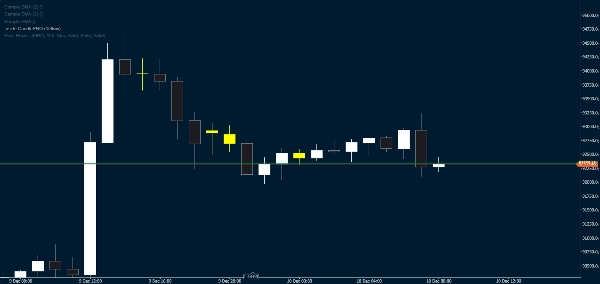
Um Inside Bar ocorre quando uma vela está completamente contida dentro do intervalo da vela anterior (máxima menor e mínima maior). Este padrão indica consolidação do mercado e pode preceder movimentos significativos de preço.
Principais Características:
- Detecção automática em tempo real de Inside Bars
- Destaque visual com cores personalizáveis
- Desempenho otimizado para operação suave
- Funciona em todos os prazos e instrumentos
- Interface simples e intuitiva
Por que Usar o Inside Candle PRO?
- Identifique rapidamente zonas de consolidação
- Prepare-se para possíveis rompimentos
- Melhore sua análise técnica visual
- Economize tempo identificando padrões
Personalização:
Escolha entre 8 cores diferentes para destacar Inside Bars, adaptando o indicador ao estilo do seu gráfico.
Compatibilidade:
Funciona em todos os instrumentos (Forex, Índices, Ações, Criptomoedas) e em qualquer prazo.
Resumo
The tool operates smoothly across all timeframes and instruments, including Forex, indices, stocks, cryptocurrencies, and commodities. Its interface is simple and intuitive, enabling traders to quickly identify consolidation zones and prepare for potential breakouts. Inside Candle PRO enhances visual technical analysis by saving time in pattern recognition and improving chart readability.
Key features include automatic real-time detection, visual highlighting, optimized performance, broad market compatibility, and customization options. It supports major symbols such as BTCUSD, EURUSD, GBPUSD, NZDUSD, USDJPY, XAUUSD, and NAS100, among others. This indicator is suitable for traders seeking to incorporate Inside Bar pattern analysis into their trading strategies across diverse markets and timeframes.
Avaliações de clientes
5 | 100 % | |
4 | 0 % | |
3 | 0 % | |
2 | 0 % | |
1 | 0 % |


![Logótipo de "[Stellar Strategies] Smart ADX"](https://cdn.ctrader.com/image/webp/af13b084-b6f6-41db-b7bc-c7e688b57b05_36929)


