
الوصف
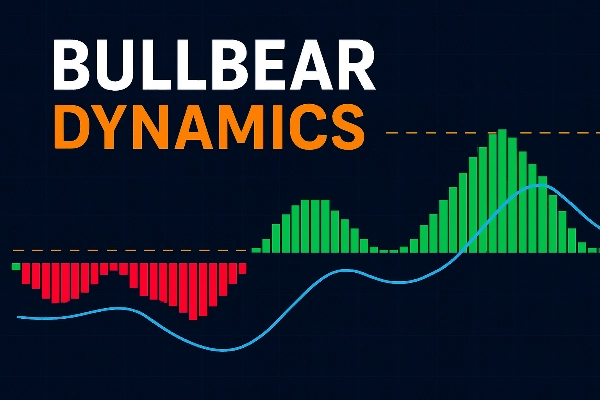
ديناميكيات بولبير — مؤشر الاتجاه والزخم لمنصة cTrader
ديناميكيات بولبير هو مؤشر قوي وواعٍ للتقلبات لمنصة cTrader، مصمم لمساعدة المتداولين على اكتشاف وتفسير التوازن بين زخم الصعود وزخم الهبوط في السوق. يجمع بين المتوسطات المتحركة، وتطبيع ATR، والعتبات الديناميكية لتوفير أداة دقيقة وبصرية بديهية لتقييم الاتجاه.
المنهجية والمنطق الداخلي
يقوم المؤشر بحساب متوسطين متحركين أسيين (EMA): متوسط قصير الأجل ومتوسط طويل الأجل.
ثم يأخذ الفرق بين هذين المتوسطين ويقسمه على متوسط المدى الحقيقي (ATR). يساعد هذا التطبيع في تعديل إشارات الزخم بالنسبة لتقلبات السوق الحالية.
خط الإشارة — وهو EMA مطبق على القيم المُطَبَّعة — يقوم بتصفية الضوضاء وتنعيم التقلبات الطفيفة.
لتمييز الحركات الضعيفة عن القوية، تحسب الأداة الانحراف المعياري المتداول (StdDev) خلال نافذة زمنية محددة وتضربه في عامل لتحديد العتبات العليا والدنيا.
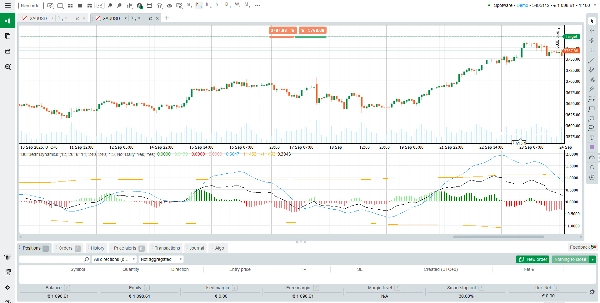
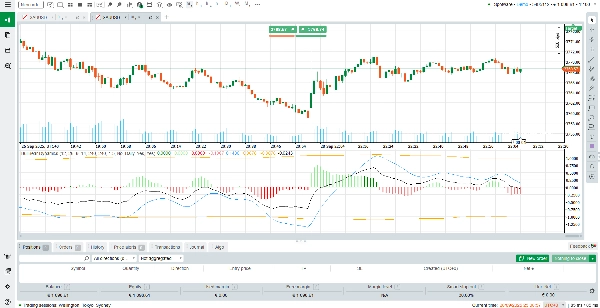
يتم عرض الناتج النهائي كمدرج تكراري (مع حالات لونية متعددة) بالإضافة إلى خط الإشارة وحدود العتبات.
كيفية قراءة وتفسير الناتج
أعمدة المدرج التكراري (أخضر / أحمر):
• اللون الأخضر يشير إلى زخم صعودي؛ الأحمر يشير إلى زخم هبوطي.
• اللون القوي (الأكثر سطوعًا أو امتلاءً) يعني أن المدرج التكراري يتجاوز العتبة — مما يدل على حركة قوية.
• اللون الأضعف يعني أن المدرج التكراري يبقى داخل حدود العتبة — مما يدل على زخم خفيف أو ضوضاء.
خط الإشارة:
• يعمل كخط أساس مرجعي.
• عندما يعبر المدرج التكراري فوق خط الإشارة، فهذا يشير إلى احتمال تقوية الزخم الصعودي.
• وعندما يعبر تحته، يشير إلى احتمال تقوية الزخم الهبوطي.
خطوط العتبة (العليا والدنيا):
• هذه الخطوط المتقطعة تحدد مناطق ذات أهمية.
• عبور عمود المدرج التكراري خارج العتبة يدل على حركة زخم قوية وذات ثقة عالية.
• الأعمدة التي تبقى ضمن العتبات تشير إلى نطاق أو تردد — الإشارات أقل موثوقية.
السيناريوهات والقراءات:
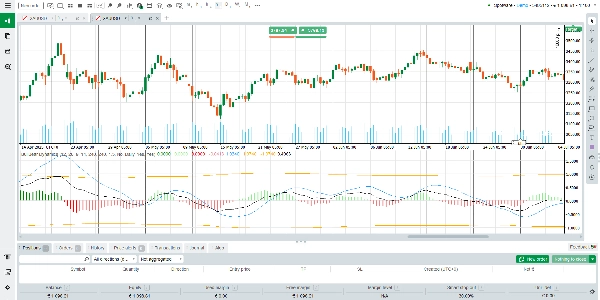
زخم صعودي — أعمدة خضراء فوق خط الإشارة، ويفضل أن تعبر العتبة العليا أيضًا.
زخم هبوطي — أعمدة حمراء تحت خط الإشارة، ويفضل أن تعبر العتبة الدنيا أيضًا.
محايد / متذبذب — الأعمدة تتأرجح ضمن العتبات، قد تتناوب الألوان، بسعة صغيرة.
تحول أو انعكاس الزخم — يعبر المدرج التكراري خط الإشارة، مصحوبًا بتغير اللون؛ وإذا كسر العتبة أيضًا، يكون أكثر موثوقية.
اقتراحات الاستخدام وأفضل الممارسات
استخدم ديناميكيات بولبير مع أدوات أخرى (مرشحات الاتجاه، الدعم/المقاومة، تحليل الأنماط) للتأكيد.
كن حذرًا عند تفسير الإشارات خلال فترات التقلب المنخفض عندما تبقى أعمدة المدرج التكراري داخل العتبات.
فضل الإشارات التي يعبر فيها المدرج التكراري خط الإشارة ويكسر العتبات.
أكد توافق الاتجاه على أطر زمنية أعلى قبل اتخاذ إجراءات بناءً على إشارات الأطر الزمنية الأدنى.
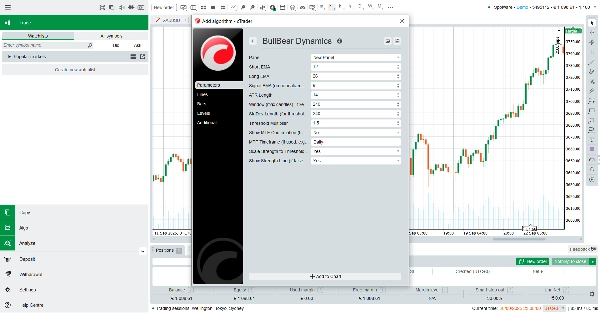
قم بضبط المعلمات (طول EMA، مضاعف العتبة، نافذة StdDev) حسب الحاجة لتناسب الأسواق المختلفة (الفوركس، المؤشرات، السلع، العملات الرقمية).
الميزات الرئيسية والنقاط البارزة
تطبيع متكيف مع التقلب — يتم قياس الزخم بواسطة ATR، لذا تكون الإشارات أكثر موثوقية عبر بيئات السوق المتغيرة.
عتبات ديناميكية — مبنية على الانحراف المعياري المتداول، تتكيف مع ظروف السوق السائدة، مما يساعد على تقليل الكسر الخاطئ.
مدرج تكراري متعدد الألوان واضح — تمييز بصري بين الزخم القوي والضعيف، والصعودي والهبوطي.
توافق واسع — يعمل على جميع الأدوات والأطر الزمنية المدعومة من cTrader.
مجاني للاستخدام — متاح بدون تكلفة؛ مثالي للمتداولين الذين يرغبون في قدرات مؤشر متقدمة بدون اشتراك.
الملخص
The output is displayed as a multi-color histogram with green bars indicating bullish momentum and red bars indicating bearish momentum. The intensity of the colors reflects the strength of the momentum relative to dynamically calculated upper and lower thresholds. The signal line serves as a baseline to identify potential momentum shifts when the histogram crosses it. Threshold lines mark zones of significant momentum moves, with bars crossing these lines signaling stronger trends.
BullBear Dynamics supports all instruments and timeframes available on cTrader, including Forex, commodities, indices, and cryptocurrencies. It is recommended to use this indicator alongside other analysis tools for confirmation and to adjust its parameters to fit different market conditions and trading styles such as scalping.
تقييمات العملاء
5 | 100 % | |
4 | 0 % | |
3 | 0 % | |
2 | 0 % | |
1 | 0 % |


