
Mô tả
Giới thiệu về ADX
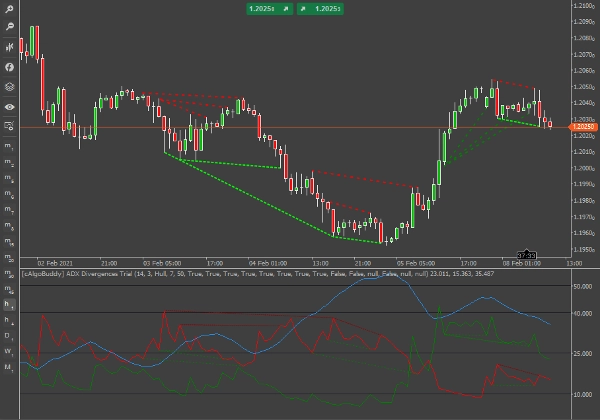
ADX (đường màu xanh dương) được vẽ dưới dạng một đường duy nhất với giá trị dao động từ thấp nhất là 0 đến cao nhất là 100. ADX là không định hướng; nó ghi nhận sức mạnh xu hướng dù giá đang tăng hay giảm. Chỉ báo này thường được vẽ trong cùng một cửa sổ với hai đường chỉ báo chuyển động định hướng (Di+ và Di-), từ đó ADX được suy ra.
Chỉ báo này phát hiện sự phân kỳ trên các đường Di+ và Di-. Khác với các chỉ báo khác phát hiện phân kỳ, với chỉ báo này, chúng ta có thể trích xuất nhiều thông tin giá trị hơn từ hai phần còn lại của tín hiệu phân kỳ. Ví dụ, nếu có phân kỳ xảy ra trên Di+, chúng ta có thể đánh giá tín hiệu dựa trên mức Di- và ADX.
Các đường Di+ và Di- được làm mượt một phần bằng trung bình động Hull trên 3 chu kỳ. Để có sự phân kỳ 100%, bạn có thể đặt chu kỳ MA là 1 và loại trung bình động là Simple. Tuy nhiên, vì chúng ta vẽ phân kỳ trên 2 đường trong cùng một cửa sổ chỉ báo, đôi khi bạn có thể cảm thấy quá tải với các tín hiệu. Mặt khác, bạn có thể chọn trong cài đặt chỉ báo chính xác loại phân kỳ nào bạn muốn xem và cho đường nào (Di+ hoặc Di-).
Tín hiệu phân kỳ được coi là xác nhận tại thời điểm mở cửa thanh nến sau phân kỳ. Tuy nhiên, do tính “cứng nhắc” của các đường xu hướng ADX (so với, ví dụ RSI) mỗi khi một đường phân kỳ xuất hiện, nó có thể sẽ giữ nguyên cho đến thanh xác nhận, trừ khi xảy ra biến động cực đoan.
Trước khi giao dịch bất kỳ tín hiệu phân kỳ nào, hãy xác định các yếu tố sau:
- Hướng và mức độ của ADX
- Khoảng cách giữa Di+ và Di-
- Hướng và mức độ của Di+
- Hướng và mức độ của Di-
Ngoài ra, hãy nhớ
- Tránh giao dịch phân kỳ khi ADX thấp (dưới 15 và xu hướng giảm), vì các tín hiệu nên được lấy dựa trên các xu hướng đã phát triển hoặc đang phát triển.
- Cũng lưu ý rằng sự giao cắt của Di+ và Di- được coi là tín hiệu tăng/giảm riêng biệt, vì vậy hãy điều chỉnh vị thế của bạn cho phù hợp.
- Trong trường hợp cả Di+ và Di- đều phân kỳ trên cùng một cây nến, hãy chọn đường tương ứng tốt hơn tùy theo xu hướng (xu hướng tăng/tín hiệu tăng Di+, xu hướng giảm/tín hiệu giảm Di-).
- Bạn không cần phải giao dịch mọi tín hiệu.
Phân kỳ trên DiPlus
DiPlus (Màu xanh lá) là đường biểu diễn sức mạnh xu hướng tăng. Chúng ta có thể phát hiện phân kỳ giữa sức mạnh xu hướng tăng tương tự như với hầu hết các bộ dao động.
Phân kỳ tăng thường
Định nghĩa: Giá tạo đáy thấp hơn nhưng chỉ báo tạo đáy cao hơn. Kết quả lý tưởng là: Sau một cú nhấp tăng nhỏ, chúng ta nên thấy một xu hướng giảm phát triển. Được vẽ bằng đường chấm màu xanh lá nhạt trong cửa sổ giá và chỉ báo.
Một xu hướng giảm chiếm ưu thế đang bắt đầu phát triển hoặc đã phát triển. Chúng ta vào lệnh bán sau khi điều chỉnh nhỏ đã xảy ra. Trong một số trường hợp, phân kỳ trên Di+ có thể xảy ra trên cây nến giảm, đây là sự xác nhận tốt cho xu hướng giảm chiếm ưu thế.
Thỉnh thoảng, cú nhấp tăng sẽ phát triển thành xu hướng tăng. Điều này có thể xảy ra khi gần như không có xu hướng (Di+ và Di- gần nhau, ADX< 20) hoặc sau khi xu hướng giảm kiệt sức ở các mức kháng cự.
Phân kỳ tăng ẩn
Định nghĩa: Giá tạo đáy cao hơn và chỉ báo tạo đáy thấp hơn. Chúng ta nên kỳ vọng sự phát triển hoặc tiếp tục của xu hướng tăng. Được vẽ bằng đường chấm một phần màu xanh đậm trong cửa sổ giá và chỉ báo.
Một xu hướng tăng chiếm ưu thế đang bắt đầu phát triển hoặc đã phát triển. Chúng ta vào lệnh mua sau khi điều chỉnh nhỏ đã xảy ra. Stop-loss nên được đặt quanh mức thấp của cây nến phân kỳ.
Đây là một trong những tín hiệu tốt hơn của chỉ báo này, chủ yếu vì chúng ta kỳ vọng sự tiếp tục xu hướng ngay lập tức và có thể giữ mức stop-loss ở mức tối thiểu.
Phân kỳ giảm thường
Định nghĩa: Giá tạo đỉnh cao hơn nhưng chỉ báo tạo đỉnh thấp hơn. Sau một cú giảm nhỏ, chúng ta nên thấy một xu hướng tăng phát triển. Được vẽ bằng đường chấm màu đỏ đậm trong cửa sổ giá và chỉ báo.
Một xu hướng tăng chiếm ưu thế vẫn đang tăng (ADX vẫn tăng trong thời gian phân kỳ).
Các trường hợp xảy ra kịch bản này là rất hiếm vì Di+ đại diện cho sức mạnh tăng giá. Thông thường, các trường hợp này xảy ra sau khi xu hướng tăng đã kiệt sức, nghĩa là đây là “đỉnh” cuối cùng trước khi xu hướng giảm bắt đầu phát triển. Vì vậy, phần lớn thời gian nên vào lệnh bán theo tín hiệu này.
Phân kỳ giảm ẩn
Định nghĩa: Giá tạo đỉnh thấp hơn và chỉ báo tạo đỉnh cao hơn. Chúng ta nên kỳ vọng sự tiếp tục xu hướng giảm. Được vẽ bằng đường chấm một phần màu đỏ trong cửa sổ giá và chỉ báo.
Một xu hướng giảm chiếm ưu thế với các đợt tăng đột biến (ADX vẫn tăng trong thời gian phân kỳ).
Yêu cầu sự tiếp tục xu hướng giảm từ đường xu hướng tăng là phi logic, vì vậy tín hiệu này nên được xử lý rất thận trọng. Thường thì thị trường sẽ bước vào giai đoạn tích lũy sau phân kỳ này.
Trong thị trường không có xu hướng, tránh giao dịch. Trong xu hướng giảm kiệt sức, nếu bạn chọn vào lệnh bán, hãy giao dịch ngắn hạn.
Phân kỳ trên DiMinus
DiMinus (Màu đỏ) là đường biểu diễn sức mạnh xu hướng giảm. Cách chúng ta phát hiện phân kỳ trên giá và DiMinus phần nào ngược lại với cách phát hiện phân kỳ trên DiPlus.
Phân kỳ tăng thường
Định nghĩa: Giá tạo đáy thấp hơn nhưng chỉ báo tạo đỉnh thấp hơn (thay vì đáy cao hơn). Sau một cú nhấp tăng nhỏ, chúng ta nên thấy một xu hướng giảm phát triển. Được vẽ bằng đường chấm màu xanh lá nhạt trong cửa sổ giá và đường chấm màu đỏ đậm trong cửa sổ chỉ báo.
Một xu hướng giảm chiếm ưu thế đang bắt đầu phát triển hoặc đã phát triển. Chúng ta vào lệnh bán sau khi điều chỉnh nhỏ đã xảy ra. Trong một số trường hợp, phân kỳ trên Di- có thể xảy ra trên cây nến giảm, đây là sự xác nhận tốt cho xu hướng giảm chiếm ưu thế.
Giống như tín hiệu từ phần đối ứng Di+, đôi khi cú nhấp giảm sẽ phát triển thành xu hướng giảm. Điều này có thể xảy ra khi gần như không có xu hướng (Di+ và Di- gần nhau, ADX< 20) hoặc sau khi xu hướng tăng kiệt sức ở các mức kháng cự.
Phân kỳ tăng ẩn
Định nghĩa: Giá tạo đáy cao hơn và chỉ báo tạo đỉnh cao hơn (thay vì đáy thấp hơn). Chúng ta nên kỳ vọng sự tiếp tục xu hướng tăng. Được vẽ bằng đường chấm một phần màu xanh lá trong cửa sổ giá và đường chấm một phần màu đỏ đậm trong cửa sổ chỉ báo.
Việc yêu cầu sự tiếp tục xu hướng tăng từ đường xu hướng Di- là phi logic. Chúng ta cần có các đợt giảm trong xu hướng tăng.
Phân kỳ giảm thường
Định nghĩa: Giá tạo đỉnh cao hơn nhưng chỉ báo tạo đáy cao hơn (thay vì đỉnh thấp hơn). Sau một cú giảm giá, chúng ta nên thấy sự tiếp tục xu hướng tăng. Được vẽ bằng đường chấm màu đỏ đậm trong cửa sổ giá và đường chấm màu xanh lá nhạt trong cửa sổ chỉ báo.
Khuyến nghị, trong xu hướng tăng mạnh và đang phát triển thì vào lệnh mua. Nhưng trong thị trường tăng kiệt sức và đã hết đà, hãy vào lệnh bán.
Phân kỳ giảm ẩn
Giá tạo đỉnh thấp hơn và chỉ báo tạo đáy thấp hơn (thay vì đỉnh cao hơn). Chúng ta nên kỳ vọng sự tiếp tục xu hướng giảm. Được vẽ bằng đường chấm một phần màu đỏ trong cửa sổ giá và đường chấm một phần màu xanh lá trong cửa sổ chỉ báo.
Đây là một trong những tín hiệu tốt hơn của chỉ báo này, chủ yếu vì chúng ta kỳ vọng sự tiếp tục xu hướng giảm ngay lập tức và có thể giữ mức stop-loss ở mức tối thiểu. Stop-loss nên được đặt tại mức thấp của cây nến phân kỳ.
Cảnh báo tin nhắn Telegram ngay lập tức
Giả sử bạn đã thiết lập bot và kênh trên Telegram, chỉ báo ADX Divergences sẽ gửi tin nhắn cho bạn về các tín hiệu đã được xác nhận trên cặp tiền tệ mà bạn chạy chỉ báo. Lưu ý rằng bạn chỉ nhận được tín hiệu cho những loại bạn đã chọn "Yes" để hiển thị. Bạn có thể cấu hình robot giao dịch này để gửi cảnh báo Telegram ngay lập tức trực tiếp đến PC, máy tính bảng hoặc điện thoại di động của bạn.
QUAN TRỌNG: Vui lòng đảm bảo Múi giờ của bạn được điều chỉnh chính xác theo giờ địa phương (góc dưới bên phải của ứng dụng).
Cảnh báo trên máy tính để bàn
Nếu bạn chọn Yes, chỉ báo ADX Divergences sẽ đẩy thông báo hộp tin nhắn trên máy tính cá nhân của bạn khi có tín hiệu được xác nhận.
Cảnh báo Email
Để chức năng này hoạt động, bạn phải cấu hình cTrader của mình để có thể gửi email (Cài đặt-> Email). Nếu bạn chọn Yes, chỉ báo ADX Divergences sẽ gửi email về các tín hiệu được xác nhận đến địa chỉ bạn đã nhập.
Tóm tắt
This indicator detects divergences on both Di+ and Di- lines, allowing traders to analyze signals with additional context from the other directional lines and ADX levels. The Di+ and Di- lines are smoothed using a Hull moving average, adjustable via settings to control signal sensitivity and display preferences.
Divergence signals are confirmed at the opening of the bar following the divergence, with guidance provided on interpreting various divergence types—regular and hidden bullish and bearish divergences—on both Di+ and Di- lines. Users are advised to consider ADX levels, the distance between Di+ and Di-, and the direction and level of each line before trading signals.
The indicator supports instant alerts via Telegram messages, desktop notifications, and email, configurable within the platform. Proper time zone settings are required for accurate alert timing. This tool is applicable across multiple markets including Forex, commodities, indices, stocks, and cryptocurrencies such as BTCUSD and XAUUSD.
Đánh giá của khách hàng
5 | 100 % | |
4 | 0 % | |
3 | 0 % | |
2 | 0 % | |
1 | 0 % |


