Mô tả
Mô tả ngắn gọn
Bản đồ Chế độ Xu hướng & Khối lượng là một bộ lọc chế độ cho cTrader đo lường hướng đi và tính bền vững của cả giá và khối lượng. Nó cung cấp cho bạn điểm xu hướng chuẩn hóa và điểm xu hướng khối lượng trong khoảng –10 đến +10, tô màu nến của bạn với một dải màu mượt từ đỏ giảm đến xanh tăng, và hiển thị liệu môi trường hiện tại là rủi ro-on, rủi ro-off, hay chỉ là ồn ào.
🧠 Nó làm gì
Chỉ báo này sao chép logic của “Bộ lọc Chế độ” của BigBeluga từ TradingView, được điều chỉnh cho cTrader và gói gọn trong một bản đồ chế độ xu hướng & khối lượng rõ ràng.
Giá & khối lượng được làm mượt
- Tính toán HLC3 (trung bình của Cao, Thấp, Đóng) và áp dụng Đường Trung bình Động Hull (HMA) để làm mượt giá.
- Áp dụng một Đường Trung bình Động Hull khác cho khối lượng tick.
Điểm xu hướng (giá)
- Trong N thanh gần đây (
Độ dài), nó so sánh HMA hiện tại của giá với từng giá trị HMA trong quá khứ:
- Nếu HMA hiện tại > HMA quá khứ → xu hướng +1
- Nếu HMA hiện tại ≤ HMA quá khứ → xu hướng –1
- Điểm tích lũy được chuẩn hóa về –10 … +10 → đây là Giá trị Xu hướng.
Điểm xu hướng khối lượng
- Sử dụng cùng logic, nhưng áp dụng cho HMA của khối lượng.
- Kết quả là một điểm chuẩn hóa khác trong –10 … +10 → là Giá trị Khối lượng.
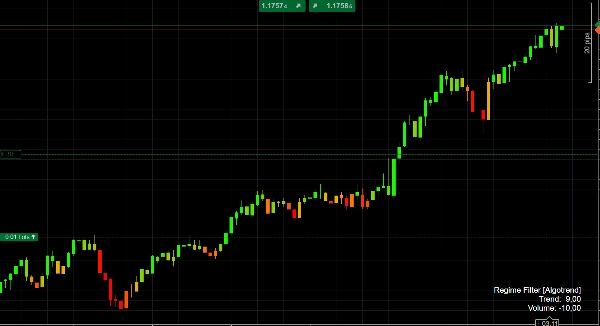
Logic màu sắc
- Khi Điểm xu hướng âm, nến được tô màu với dải màu đỏ → cam tùy theo mức độ mạnh của chế độ giảm.
- Khi Điểm xu hướng dương, nến được tô màu cam → xanh chanh, với màu xanh đậm hơn cho các chế độ tăng mạnh hơn.
Điều này cung cấp cho bạn tín hiệu trực quan ngay lập tức về việc hành động giá là giảm, trung tính hay tăng, và mức độ bền vững của chế độ đó hiện tại.
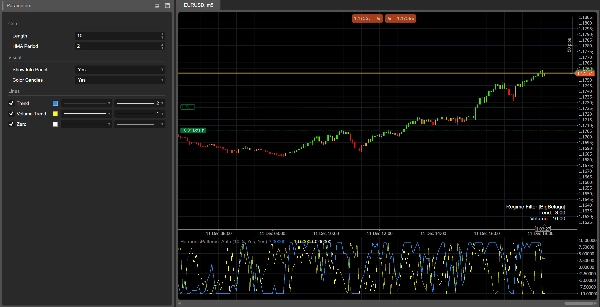
Bảng chế độ
Trong cửa sổ phụ, chỉ báo vẽ:
- Đường xu hướng (xanh dương)
- Đường xu hướng khối lượng (xám)
- Đường số 0 (đường cơ sở)
Ở thanh cuối cùng, nó in một bảng thông tin nhỏ với các giá trị hiện tại của Xu hướng và Khối lượng.
🎯 Cách bạn có thể sử dụng nó
Xác nhận xu hướng
- Chỉ giao dịch theo hướng của chế độ mạnh, ví dụ:
- Xu hướng > +4 → thiên hướng chỉ mua
- Xu hướng < –4 → thiên hướng chỉ bán
Bộ lọc chế độ
- Tắt hoặc giảm quy mô chiến lược của bạn khi chế độ yếu (Xu hướng gần 0) hoặc khi Xu hướng khối lượng rất âm, điều này thường báo hiệu các chuyển động lộn xộn hoặc suy yếu.
Ngữ cảnh cho các tín hiệu
Kết hợp các tín hiệu vào lệnh hiện có của bạn (hành động giá, mẫu hài hòa, dao động, v.v.) với Bản đồ Chế độ Xu hướng & Khối lượng như một bộ lọc vĩ mô:
- Chỉ thực hiện đột phá khi Xu hướng dương và Xu hướng Khối lượng cũng dương.
- Tránh các thiết lập quay về trung bình khi Xu hướng cực mạnh (> +8 hoặc < –8), vì thị trường đang trong chế độ định hướng mạnh mẽ.
⚙️ Tham số đầu vào
Cốt lõi
Độ dài
Số thanh được sử dụng để xây dựng điểm xu hướng và khối lượng.
- Giá trị cao hơn → chế độ “vĩ mô” mượt hơn, chậm thay đổi nhưng ổn định hơn.
- Giá trị thấp hơn → phản ứng nhanh hơn, nhưng nhiều nhiễu và thay đổi thường xuyên hơn.
Chu kỳ HMA
Chu kỳ của Đường Trung bình Động Hull được sử dụng để làm mượt cả giá và khối lượng.
- Điều chỉnh để phù hợp với khung thời gian và phong cách giao dịch của bạn: ngắn hơn cho khung thời gian thấp, dài hơn cho khung thời gian cao hơn.
Hình ảnh
Hiển thị Bảng Thông tin
Hiển thị/ẩn bảng văn bản nhỏ trên thanh cuối cùng với điểm hiện tại của Xu hướng và Khối lượng.Tô màu nến
Cho phép tô màu nến dựa trên giá trị Xu hướng (dải màu đỏ / cam / xanh). Tắt nếu bạn muốn giữ màu biểu đồ mặc định của mình.
✅ Bảng giải thích nhanh
- Xu hướng ≥ +7 → chế độ tăng mạnh, nến màu xanh sáng.
- Xu hướng từ +3 đến +7 → thiên hướng tăng; các đợt giảm là vùng tiềm năng để mua vào.
- Xu hướng từ –3 đến +3 → đi ngang / lộn xộn; tín hiệu kém tin cậy hơn.
- Xu hướng ≤ –7 → chế độ giảm mạnh, nến màu đỏ đậm.
- Xu hướng khối lượng > 0 → hoạt động tăng / duy trì, các chuyển động có khả năng “thật” và bền vững hơn.
- Xu hướng khối lượng < 0 → sự tham gia giảm, rủi ro cao hơn về các chuyển động giả, lộn xộn hoặc đảo chiều.
Tóm tắt
Đánh giá của khách hàng
5 | 0 % | |
4 | 100 % | |
3 | 0 % | |
2 | 0 % | |
1 | 0 % |


