🚀 Hơn 10.000 nhà giao dịch đã sử dụng các chỉ báo TOP của chúng tôi 🏆 …và cộng đồng vẫn tiếp tục phát triển!
Khám phá lý do tại sao các chuyên gia chọn chúng tôi – cTrader với các công cụ mạnh mẽ nhất (chỉ báo + thuật toán + cBots) đang chờ bạn.
👉 Nhận tất cả các hệ thống TOP của chúng tôi tại đây:
Chỉ báo cửa hàng Pinescriptlabs: cBots cửa hàng Pinescriptlabs : (cBot) Gold & BTC BreakoutSession Pivots(mới)
Thuật toán thông minh theo sau (mới)
Hỗ trợ &
Kháng cự SmartTrend
Đường
Phiên chênh lệch giá trị công bằng
Phân tích
Cấu trúc thị trường
Động
của
Điểm
Quay đầu
Fibonacci
Hồi quy tuyến tính
Đa khung thời gian
Regression
Khoảng trống giá trị công bằng động lực
Theo dõi
Định hướng nến đa cấp
đa cấp
Tự động
Hỗ trợ và
Kháng cự
Xu hướng
Đường
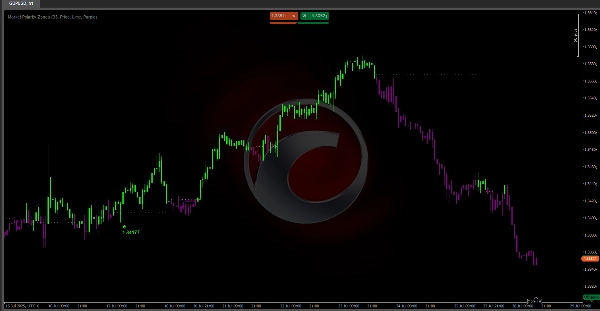
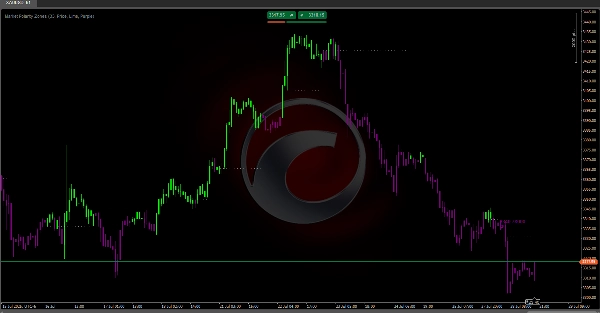
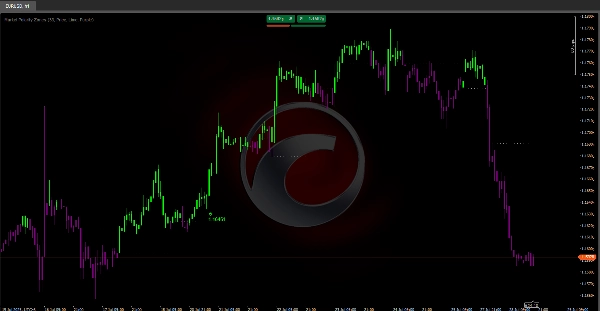
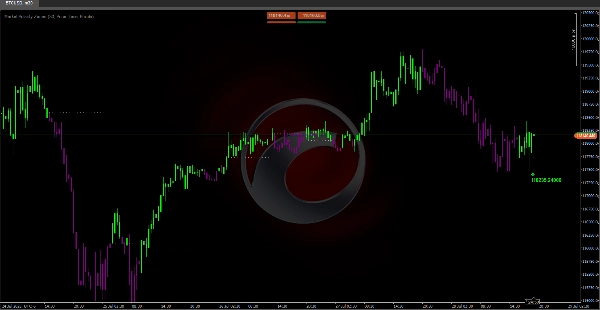
Vùng phân cực thị trường 📊
Thuật toán này làm gì?
Vùng phân cực thị trường là một chỉ báo tiên tiến giúp đơn giản hóa phân tích thị trường bằng cách tự động xác định giai đoạn tăng giá 🚀 hoặc giảm giá 🐻 và đánh dấu các mức quan trọng nơi khả năng đảo chiều xu hướng cao.
Phù hợp cho:
- Nhà giao dịch theo hành động giá
- Nhà giao dịch lướt sóng
- Nhà giao dịch lướt sóng nhỏ,...những người cần nhanh chóng phát hiện hướng thị trường và điểm vào/ra chính xác.
Logic hoạt động như thế nào?
Thuật toán sử dụng hai Đường trung bình động Hull (HMA) với các chu kỳ khác nhau để phát hiện sự thay đổi động lượng và thiết lập các mức động như sau:
- Phát hiện giao cắt HMA để nhận biết sự thay đổi xu hướng.
- Thiết lập các mức tự động:
-
- Giao cắt tăng → Đánh dấu mức thấp là mức hỗ trợ
- Giao cắt giảm → Đánh dấu mức cao là mức kháng cự
- Giữ mức đang hoạt động cho đến khi có giao cắt mới xảy ra.
Bạn sẽ thấy gì trên biểu đồ của mình:
🎨 Hệ thống màu trực quan:
- Nến xanh lá 🟢: Giá trên mức (vùng tăng giá – tìm mua)
- Nến tím 🟣: Giá dưới mức (vùng giảm giá – tìm bán)
📉 Đường mức động:
- Đường ngang chấm chấm đánh dấu mức phân cực đang hoạt động
- Tự động kéo dài khi mức vẫn còn hợp lệ
- Chỉ xuất hiện khi mức ổn định
⚠️ Cảnh báo đảo chiều:
Nhãn mũi tên xuất hiện khi các mẫu hình cụ thể hình thành:
- 🔻 Đảo chiều giảm (nhãn tím):
-
- Mẫu hình: Giá tăng → thất bại → giảm xuống dưới mức
- Ý nghĩa: Áp lực tăng yếu đi, có thể chuyển sang vùng giảm giá
- 🔺 Đảo chiều tăng (nhãn xanh lá):
-
- Mẫu hình: Giá giảm → bật lên → tăng trên mức
- Ý nghĩa: Người mua bảo vệ mức, có thể chuyển sang vùng tăng giá
ℹ️ Thông tin nhãn:
- "Giá": Hiển thị điểm thất bại phá vỡ chính xác – dùng để đặt dừng lỗ chính xác hoặc xác định kháng cự/hỗ trợ quan trọng.
- "Khối lượng": Tổng khối lượng của 3 thanh cuối – xác nhận xem đảo chiều có sự tham gia thực sự của thị trường.
Cài đặt được khuyến nghị:
- Độ dài: 33 (mặc định) – Hoạt động tốt cho hầu hết các thị trường
- Dữ liệu nhãn: "Giá" cho độ chính xác mức, "Khối lượng" để xác nhận
- Màu sắc: Giữ Lime/Tím để có độ tương phản hình ảnh tốt nhất 🎨


![Logo "[Stellar Strategies] MARSI Signal Plotter"](https://cdn.ctrader.com/image/webp/7b2b8da6-8f8e-4646-8d4a-4710c516c01e_25567)