Mô tả
[ Tiêu đề ] EMA-Signal_BUY_SELL_V.2 (Bộ thông báo Hội tụ & Phá vỡ Động)
[ Mô tả ] Một chỉ báo tùy chỉnh chuyên nghiệp được thiết kế để phát hiện các biến động giá bùng nổ trước khi chúng xảy ra. Hoàn hảo cho giao dịch trong ngày nghiêng về scalping trên các tài sản có biến động cao như US500, US100 và JP225.
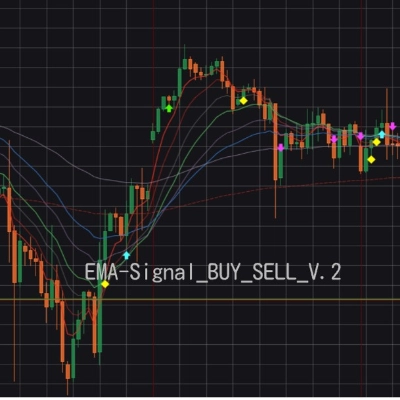
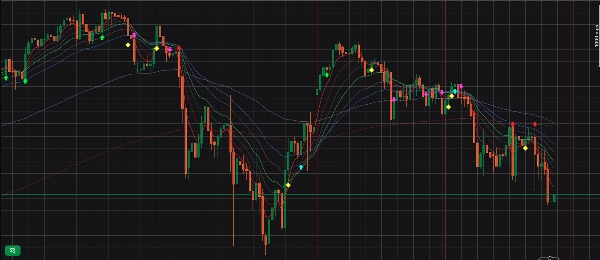
Chỉ báo này theo dõi 6 EMA (5, 9, 14, 19, 28, 38) để đo khoảng cách giữa chúng một cách động. Nó cảnh báo trực quan cho bạn về các pha thị trường từ "Hội tụ" (năng lượng tích tụ) đến "Phá vỡ" (xu hướng sớm) và "Mở rộng Trật tự Hoàn hảo" (xu hướng được xác nhận).
[ Tính năng mới V.2 ]
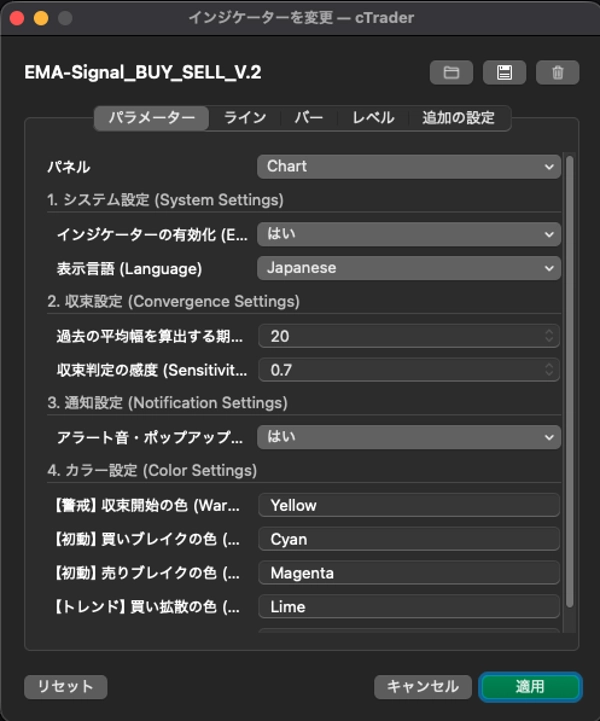
- Hỗ trợ song ngữ: Chuyển đổi giao diện tham số và thông báo cảnh báo giữa tiếng Anh và tiếng Nhật.
- Màu sắc tùy chỉnh hoàn toàn: Dễ dàng thay đổi màu của tất cả các dấu hiệu tín hiệu để phù hợp với chủ đề biểu đồ của bạn.
- Công tắc tạm dừng: Bật/Tắt ngay lập tức các tính toán và cảnh báo của chỉ báo từ các tham số.
[ Tín hiệu & Chiến thuật giao dịch ] Khi một cảnh báo được kích hoạt, kiểm tra biểu đồ và thực hiện giao dịch thủ công dựa trên các pha sau:
1. ◆ Dấu kim cương (Cảnh báo: Hội tụ)
- Ý nghĩa: Năng lượng thị trường đang bị nén lại (Thị trường đi ngang).
- Chiến thuật: KHÔNG vào lệnh. Đây là tín hiệu để bạn chuẩn bị và theo dõi cho một động thái bùng nổ sắp tới.
2. Mũi tên đầu tiên (Di chuyển đầu tiên: Phá vỡ EMA 5)
- Ý nghĩa: EMA 5 gần nhất đã hoàn toàn phá vỡ cụm của 5 EMA còn lại.
- Chiến thuật: Đây là dấu hiệu sớm nhất của một xu hướng hình thành sau hội tụ. Lý tưởng cho các lệnh vào sớm mang tính quyết đoán.
3. Mũi tên thứ hai (Xu hướng: Mở rộng Trật tự Hoàn hảo)
- Ý nghĩa: Tất cả các EMA được căn chỉnh hoàn hảo và đang xòe ra.
- Chiến thuật: Xu hướng đã được xác nhận hoàn toàn. Đây là điểm vào lệnh an toàn và có xác suất thành công cao nhất.
🔥 Mẫu Vàng 🔥 Kim cương (Nạp năng lượng) > Mũi tên đầu tiên (Phá vỡ sớm) > Mũi tên thứ hai (Xác nhận xu hướng). Khi các tín hiệu sáng lên theo đúng thứ tự này, nó đại diện cho thiết lập chắc chắn và được mong đợi nhất.
[ Cách thiết lập ]
- Áp dụng "EMA-Signal_BUY_SELL_V.2" lên biểu đồ của bạn (ví dụ: khung thời gian 15 phút).
- (Khuyến nghị) Thêm thủ công 6 EMA tiêu chuẩn (5, 9, 14, 19, 28, 38) vào biểu đồ để xác nhận tín hiệu rõ ràng hơn về mặt trực quan.
【 日本語 バージョン 】
[ タイトル ] EMA-Signal_BUY_SELL_V.2 (ダイナミック収束&ブレイクアウト通知)
[ 説明文 ] 爆発的なトレンドが発生する「初動」を的確に捉えるために開発された、プロ仕様のカスタムインジケーターです。US500、US100、JP225などのボラティリティが高い銘柄での、スキャルピング寄りのデイトレードに最適です。
6本のEMA(5, 9, 14, 19, 28, 38)の幅を監視し、相場のエネルギーが溜まる「収束」から、トレンドが発生する「初動ブレイク」、そして「パーフェクトオーダーの拡散」までを視覚的なマークとポップアップ・アラートでお知らせします。
[ V.2 の新機能 ]
- 日英言語切り替え: パラメーター画面とアラート通知を「日本語 / English」で自由に切り替え可能。
- カラーの完全カスタマイズ: 5種類のシグナルマークの色を、ご自身のチャート背景に合わせて自由に変更可能。
- 一時停止スイッチ: チャートから削除することなく、パラメーターからワンタッチで計算と通知を一時停止可能。
[ シグナルの意味とトレード戦術 ] アラートが鳴ったらチャートを確認し、以下の状況に合わせて判断を下します。
1. ◆ ダイヤマーク(【警戒】収束の開始)
- 意味: 相場のエネルギーが溜まり始めました(レンジ相場)。
- 戦術: ここでエントリーしてはいけません。次に価格が上下どちらかに爆発するのを待つ「準備・監視」の合図です。
2. 最初の矢印(【初動】EMA5のブレイクアウト)
- 意味: EMA5が、他の5本の束を完全にぶち抜きました。
- 戦術: 収束状態のあとにこれが出たら、トレンド発生の一番早い初動サインです。アグレッシブに攻める(打診買い/売り)タイミングです。
3. 2番目の矢印(【トレンド】パーフェクトオーダーの拡散)
- 意味: 全てのEMAが綺麗に並び、束が扇状に広がり始めました。
- 戦術: トレンドが本格的に確定したサインです。最も勝率が高く安全なエントリーポイントとなります。
🔥 最強の黄金パターン 🔥 黄色の◆(エネルギー充電) > 初動の矢印(ブレイク) > 拡散の矢印(トレンド確定) この順番でシグナルが点灯した時は、最も期待値の高い鉄板の形(セットアップ)となります。
[ チャートへの適用方法 ]
- 対象のチャート(15分足など)に「EMA-Signal_BUY_SELL_V.2」を適用します。
- (推奨)視覚的にもわかりやすくするために、標準のEMAを6本(5, 9, 14, 19, 28, 38)チャート上に手動で追加表示してご利用ください。
Tóm tắt
Key signals include:
1. Diamond Mark indicating market convergence and preparation phase.
2. First Arrow signaling EMA 5 breakout as an early trend entry point.
3. Second Arrow showing perfect EMA alignment confirming a strong trend.
Traders use these signals sequentially for timing entries, especially on volatile assets like US500, US100, and JP225, with a recommended setup on 15-minute charts alongside manually added EMAs for visual confirmation. The indicator focuses on visualization and alerting of trend strength, breakouts, and reversals based on EMA dynamics.
Đánh giá của khách hàng
5 | 100 % | |
4 | 0 % | |
3 | 0 % | |
2 | 0 % | |
1 | 0 % |