
📊 Tägliches Pip-Range-Dashboard (Sitzungsorientiertes ADR-Tool)
Das Tägliche Pip-Range-Dashboard ist ein professionelles Trading-Tool, das Echtzeit-Statistiken zur täglichen Range direkt in Ihrem Chart anzeigt – vollständig auf die UTC-Sitzung Ihres Brokers abgestimmt.
Entwickelt für präzise Trader berechnet dieses Tool die High-Low-Pip-Range anhand echter sitzungsbasierter Tagesgrenzen und liefert leistungsstarke rollierende Statistiken für Marktkontext und Volatilitätsanalyse.
🔥 Hauptmerkmale
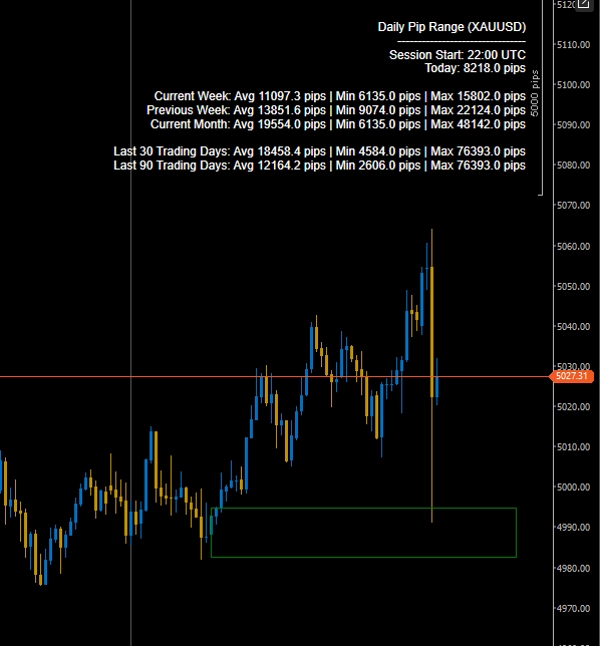
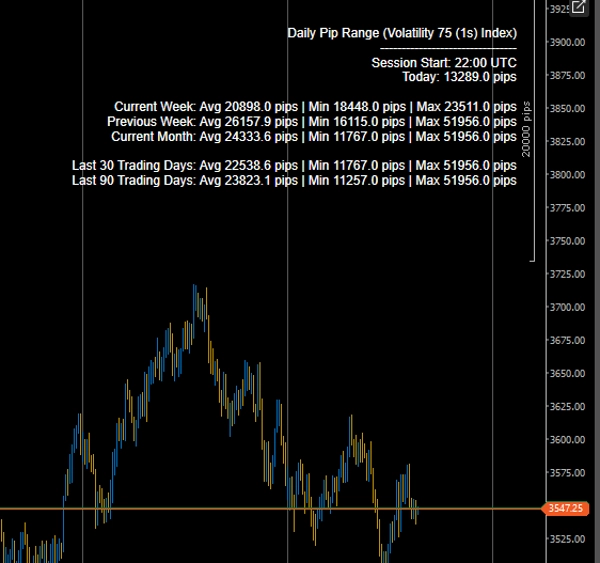
✅ Heutige Live-Tagesrange (High–Low in Pips)
Sehen Sie die Pip-Range der aktuellen Sitzung in Echtzeit aktualisiert.
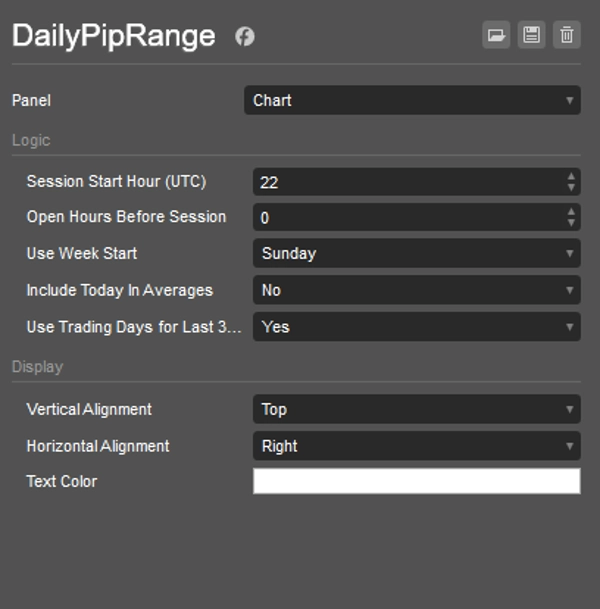
✅ Sitzungsorientierte Berechnungen (UTC-gesteuert)
Definieren Sie:
- Sitzungsstartstunde (UTC)
- Öffnungsstunden vor der Sitzung
Dies stellt sicher, dass Ihre Tagesstatistiken mit dem Handelstag Ihres Brokers übereinstimmen – ideal für NY-Close-Ausrichtung und institutionelle Analysen.
✅ Erweiterte statistische Aufschlüsselung
Für jeden Zeitraum zeigt der Indikator:
- Durchschnittliche Tagesrange
- Minimale Tagesrange
- Maximale Tagesrange
Eingeschlossene Zeiträume:
- Aktuelle Woche
- Vorherige Woche
- Aktueller Monat
- Letzte 30 Tage
- Letzte 90 Tage
✅ Umschaltung zwischen Handelstagen und Kalendertagen
Wählen Sie zwischen:
- Letzte 30/90 Kalendertage
- Letzte 30/90 Handelstage (nur Tageskerzen)
Perfekt, um Wochenenden und nicht handelbare Lücken herauszufiltern.
✅ Anpassbare Anzeige
- Anpassbare Bildschirmposition (oben rechts, etc.)
- Textfarbenanpassung
- Leichtgewichtiges und unaufdringliches Overlay
🎯 Warum dieses Tool verwenden?
- Volatilitätserweiterung und -kontraktion erkennen
- Heutige Range mit historischen Durchschnitten vergleichen
- Kompession vor Ausbrüchen erkennen
- Trades basierend auf ADR-Kontext filtern
- Risikogröße basierend auf Volatilitätsbedingungen verbessern
Egal ob Intraday-, Swing- oder Gold-Trading, dieses Tool liefert Ihnen sofortige Volatilitätsinformationen ohne Unordnung.
⚙️ Ideal für
- Forex-Trader
- Gold (XAUUSD) Trader
- Index-Trader
- Volatilitätsbasierte Systeme
- Breakout-Trader
- Institutionelle Range-Analyse
🚀 Professionelles Volatilitätsbewusstsein – direkt in Ihrem Chart
Entwickelt für Leistung, Genauigkeit und Sitzungspräzision.
5 | 50 % | |
4 | 50 % | |
3 | 0 % | |
2 | 0 % | |
1 | 0 % |


![„High-Low Divergence [Iridio Capital]“-Logo](https://cdn.ctrader.com/image/webp/443c4661-7abb-40f1-842f-4b6ec560649b_40914)


![„[CB] Pivot Points Pro“-Logo](https://cdn.ctrader.com/image/webp/43463c82-67b0-4f10-a4ba-901bba091d81_32594)

