
Description
⭐ MULTI‑TIMEFRAME SMC ZONE™ 🇫🇮
Institutional Supply & Demand Mapping Across Five Timeframes — Automatically.
Professional Product
The Multi‑Timeframe SMC Zone Engine™ is a precision‑built Smart Money Concepts indicator that automatically detects, draws, and synchronizes institutional supply and demand zones across five major timeframes — all in real time, directly on your chart.
Designed for traders who rely on market structure, liquidity behavior, and institutional footprints, this tool eliminates the guesswork and inconsistency of manual zone marking. Whether you trade intraday or swing, the Multi‑Timeframe SMC Zone Engine™ gives you a complete, multi‑layered map of where the market is most likely to react.
This is not just an indicator.
It’s a multi‑timeframe SMC intelligence system.
Core Capabilities
Automatic Supply & Demand Zone Detection
The engine scans the last X bars (user‑defined) on each timeframe and identifies:
Demand Zones (bullish imbalances)
Supply Zones (bearish imbalances)
Zones are validated using candle structure — ensuring only meaningful institutional footprints are displayed.
Five Timeframes, One Chart
The indicator simultaneously analyzes
Daily
4H
1H
30M
15M
Each timeframe is assigned a unique color, giving you a clean, layered view of higher‑timeframe strength and lower‑timeframe precision.
This multi‑timeframe fusion is what SMC traders rely on to anticipate liquidity sweeps, mitigation blocks, and premium/discount zones.
Dynamic Zone Projection
Every zone is automatically extended to the most recent candle, allowing you to see:
Where price is likely to react
Which zones are still active
How current price interacts with institutional footprints
No manual redrawing. No clutter. No outdated zones.
Professional Visuals
Each zone includes:
A colored rectangle with adjustable border width
A clear text label (“Demand: H1”, “Supply: M15”, etc.)
Smart left‑shifted placement to avoid overlapping candles
The result is a clean, readable, professional‑grade SMC map.
Why Traders Love It
Eliminates manual zone marking
Provides instant multi‑timeframe context
Helps identify high‑probability reaction points
Works with any strategy based on SMC, ICT, Wyckoff, or liquidity concepts
Clean visuals that don’t overwhelm your chart
Perfect for both intraday scalpers and swing traders
This tool gives you the institutional perspective — without the complexity.
Who This Indicator Is For
Smart Money Concepts traders
ICT‑style liquidity traders
Market structure and order‑flow traders
Scalpers who need precision
Swing traders who need higher‑timeframe context
Anyone who wants a clean, automated supply/demand map
⭐ MULTI‑TIMEFRAME SMC ZONE™
Trade with the clarity of institutional footprints — across every timeframe that matters
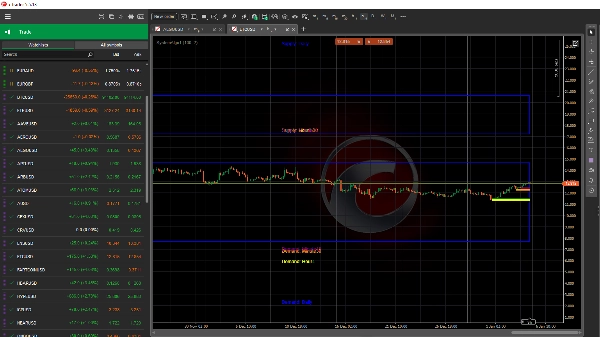
Notes
Blue = Daily demand/supply
Green = 4H demand/supply
Yellow = 1H demand/supply
Dark violet = 15 min demand/supply
pink = 5 min demand/supply
when overlapping > greater odd to succesfull trade
Summary
The indicator assigns unique colors to each timeframe’s zones for clear, layered visualization, enabling traders to assess higher-timeframe strength alongside lower-timeframe precision. Zones are dynamically extended to the latest candle, showing active areas where price is likely to react without manual redrawing or clutter.
Each zone is visually marked with a colored rectangle, adjustable border width, and clear text labels indicating timeframe and zone type, placed to avoid overlap with price candles. This tool supports trading strategies based on market structure, liquidity, and institutional footprints, including SMC, ICT, Wyckoff, and liquidity concepts.
SystemAlgo1 is suitable for intraday scalpers and swing traders seeking automated, multi-timeframe supply and demand mapping to identify high-probability reaction points across markets such as Forex, cryptocurrencies, indices, commodities, and stocks.


!["[Stellar Strategies] Inside Bar with Signals" logo](https://cdn.ctrader.com/image/webp/1d9e8bfa-3b2c-4440-bb37-5856902008a7_30683)


