
Beschreibung
🌟 **Was ist der Z-Score?** 🌟
• **Z-Score im Trading**: Es ist eine Methode, um zu messen, wie weit der aktuelle Preis von seinem jüngsten Durchschnitt entfernt ist, ausgedrückt in Standardabweichungen. 😊 Ein Wert nahe 0 zeigt an, dass der Preis nahe seinem Mittelwert liegt, während hohe Werte (positiv oder negativ) 😮 darauf hinweisen, dass er sich deutlich abgewichen hat.
• **Statistischer Nutzen**: Diese Werte ermöglichen es, Situationen zu erkennen, in denen der Preis "überkauft" 📈 oder "überverkauft" 📉 ist, was für Mean-Reversion-Strategien oder zur Erkennung von Momenten hoher Volatilität 💥 nützlich sein kann.
🌟 **Wie der Indikator funktioniert** 🌟
1. **Berechnung von Durchschnitt und Abweichung**:
- Eine bestimmte Anzahl vorheriger Balken (oder Perioden) wird analysiert, um den durchschnittlichen Schlusskurs und dessen Standardabweichung zu berechnen. 🧮
- Mit diesen Werten wird bestimmt, wie stark der aktuelle Preis vom Mittelwert abweicht. Diese Differenz wird als Z-Score ausgedrückt.
2. **Visualisierung des Z-Scores**:
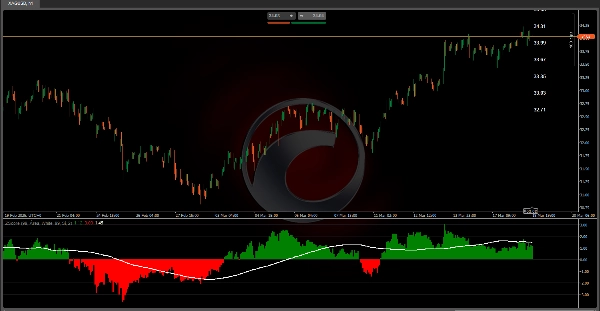
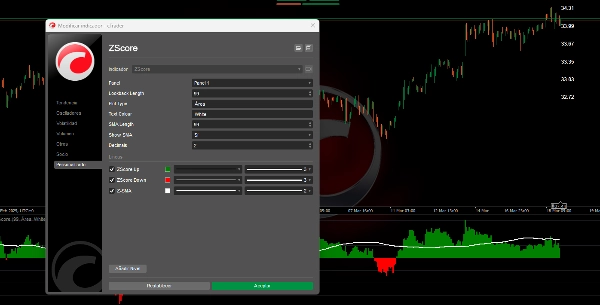
- **Flächenmodus**: Zwei Histogramme werden angezeigt: eines in Grün 🟩 für positive Werte (wenn der Preis über dem Mittelwert liegt) und eines in Rot 🔴 für negative Werte (wenn er darunter liegt). Dies ermöglicht eine visuelle Erkennung der Größe und Richtung der Abweichung.
3. **Gleitender Durchschnitt des Z-Scores**:
- Ein gleitender Durchschnitt wird über die Z-Score-Werte berechnet. Dies hilft, Schwankungen zu glätten und Trends im Verhalten der Preisabweichung über die Zeit zu erkennen. 📊
4. **Wahrscheinlichkeitszonen und Referenzbeschriftungen**:
- Zusätzlich werden Beschriftungen auf dem Chart platziert, die die Preise anzeigen, die dem Mittelwert und jedem Abweichungsniveau entsprechen. Dies ist nützlich, um in Preisbegriffen zu verstehen, wie "extrem" sich der Markt verhält. ⚠️
---
🌟 **Interpretation und Anwendung für Trader** 🌟
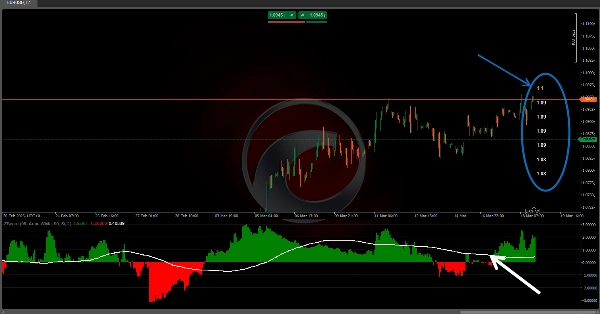
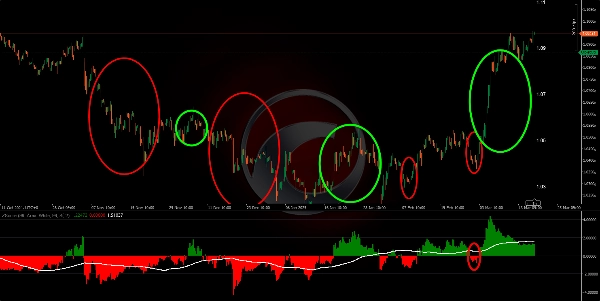
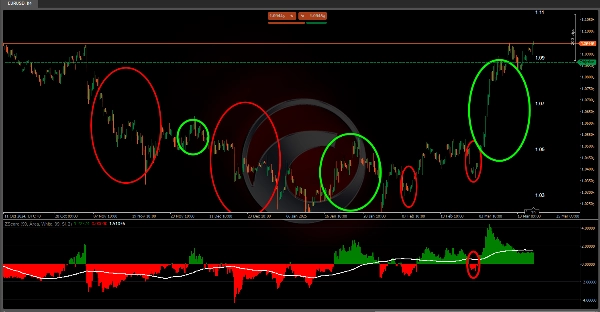
• **Erkennung von Extremen**: Durch Beobachtung sehr hoher oder sehr niedriger Werte im Indikator kann ein Trader erkennen, dass sich der Preis signifikant von seinem Durchschnitt entfernt hat. Dies kann darauf hindeuten, dass eine Korrektur wahrscheinlich ist (wenn eine Mittelwertumkehr erwartet wird) 🔄 oder dass ein starker Ausbruch stattfindet.
• **Trendbestätigung**: Der gleitende Durchschnitt des Z-Scores und die zugehörigen Bänder ermöglichen es, Veränderungen im Trend des Preisverhaltens relativ zu seinem Mittelwert zu erkennen. Ein Kreuz oder eine Änderung dieser Linien kann als Ein- 🛡️ oder Ausstiegssignal interpretiert werden.
• **Risikomanagement**: Durch Kenntnis der Abweichungsniveaus und Wahrscheinlichkeitszonen können Positionsgrößen angepasst oder Stop-Loss ⬇️ und Take-Profit ⬆️ Punkte definiert werden, da eine Referenz für normale versus extreme Bewegungen vorliegt.
• **Statistisches Verständnis des Marktes**: Über ein rein grafisches Werkzeug hinaus regt dieser Indikator dazu an, über das Marktverhalten in probabilistischen Begriffen nachzudenken. Das Wissen um die "Normalität" einer Bewegung kann ein entscheidender Faktor bei der Bewertung von Handelsmöglichkeiten sein. 🎯
🌟 **Fazit** 🌟
Dieser Algorithmus wandelt Preisdaten in eine statistische Darstellung um, die hilft, die Abweichung des Preises im Verhältnis zu seinem jüngsten Verhalten zu visualisieren und zu quantifizieren. Durch die Kombination von Z-Score, gleitendem Durchschnitt, Abweichungsbändern und einer Wahrscheinlichkeits-Tabelle bietet der Indikator mehrere Informationsschichten. Dies macht ihn besonders wertvoll, um Momente zu identifizieren, in denen sich der Markt in ungewöhnlichen Zuständen befindet, und erleichtert Entscheidungen zu Einstieg 🚀, Ausstieg 🛑 und Risikomanagement basierend auf Wahrscheinlichkeit und Statistik. 📈📉
Ctrader Store Indikatoren:
Dynamic Market Structure
Analyse von Wendepunkten
Fibonacci Linear
Regression Multi-Timeframe
Multi-Level Candle Bias
Tracker
Auto Support and
Resistance Trend Lines
Zusammenfassung
Kundenbewertungen
5 | 100 % | |
4 | 0 % | |
3 | 0 % | |
2 | 0 % | |
1 | 0 % |


![„High-Low Divergence [Iridio Capital]“-Logo](https://cdn.ctrader.com/image/webp/443c4661-7abb-40f1-842f-4b6ec560649b_40914)


