Beschreibung
Überblick
Swing Flow ist ein fortschrittlicher Trendfolgeindikator, der direkt im Kursdiagramm angezeigt wird und Ihnen ein klares, intuitives visuelles Signal gibt – ähnlich dem klassischen SuperTrend – jedoch basierend auf einer grundlegend anderen und ausgefeilteren zugrunde liegenden Logik.
Während Standard-Trendindikatoren auf jede Kerze reagieren, verankert Swing Flow seine Berechnungen an bedeutenden Marktschwungpunkten und erzeugt eine Linie, die den dominanten Trend mit deutlich weniger Rauschen und Fehlalarmen wirklich widerspiegelt.
Funktionsweise (ohne die Formel zu verraten)
Swing Flow identifiziert bedeutende Pivot-Hochs und Pivot-Tiefs im Markt – die natürlichen Wendepunkte, an denen der Kurs tatsächlich umgekehrt hat. Anschließend baut er ein dynamisches Mittelband und zwei adaptive Bänder (oberes und unteres) um diese Pivot-Punkte herum auf und wendet eine volatilitätsangepasste Glättung an, um kurzfristige Schwankungen herauszufiltern.
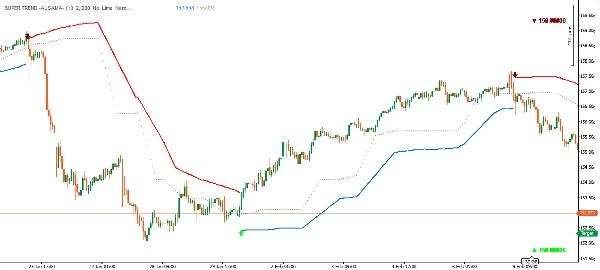
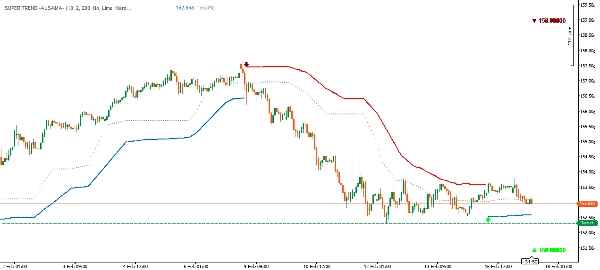
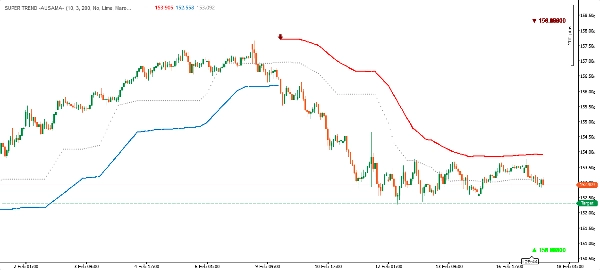
Das Ergebnis ist eine einzelne Trendlinie, die im Chart angezeigt wird:
- 🟢 Grüne Linie unter dem Kurs → Aufwärtstrend (fungiert als dynamische Unterstützung)
- 🔴 Rote Linie über dem Kurs → Abwärtstrend (fungiert als dynamischer Widerstand)
Wenn der Trend kippt, wechselt die Linie die Seite und die Farbe – genau wie beim SuperTrend – was sofort offensichtlich und handlungsfähig macht.
Indikator-Komponenten
KomponenteBeschreibung
Haupt-Trendlinie
Die primäre Signallinie – grün unter dem Kurs im Aufwärtstrend, rot darüber im Abwärtstrend
Oberes Band
Dynamisches Widerstandsniveau, angezeigt während bärischer Phasen
Unteres Band
Dynamisches Unterstützungsniveau, angezeigt während bullischer Phasen
Mittellinie
Die adaptive Mittellinie, abgeleitet aus der Marktstruktur
Signalmarker
Auf-/Ab-Pfeile mit Kursangaben bei jeder Trendwende
Pivot-Beschriftungen (optional)
Diamantmarker an Schwunghochs und -tiefs (kann ein- oder ausgeschaltet werden)
Hauptvorteile
✅ Strukturbasierte Logik
Im Gegensatz zu den meisten Trendindikatoren, die nur die jüngste Kursbewegung betrachten, basiert Swing Flow auf tatsächlichen Swing-Pivot-Punkten – den Niveaus, die der Markt selbst bereits als bedeutend validiert hat. Das macht das Trendsignal grundsätzlich aussagekräftiger.
✅ Adaptiver Volatilitätsfilter
Die Bänder passen sich automatisch der aktuellen Marktvolatilität an, ziehen sich bei ruhigen Bedingungen zusammen und weiten sich in volatilen Phasen aus. Dies reduziert Fehlsignale ohne manuelle Anpassung.
✅ Saubere SuperTrend-ähnliche Darstellung
Trotz seiner fortschrittlichen Logik ist die visuelle Ausgabe klar und vertraut. Eine Linie im Chart – grün unten, rot oben. Kein Durcheinander. Sofort auf jedem Zeitrahmen lesbar.
✅ Präzise Einstiegssignale
Jede Trendänderung wird mit einem Richtungspfeil und dem genauen Schlusskurs der Umkehrkerze markiert, was Ihnen einen klaren Bezugspunkt für Einstiege gibt.
✅ Volle Farbanpassung
Sowohl Bullen- als auch Bärenfarben sind vollständig anpassbar, um Ihrem Chartstil oder Ihren persönlichen Vorlieben zu entsprechen.
✅ Funktioniert auf allen Märkten & Zeitrahmen
Forex, Indizes, Rohstoffe, Krypto – der Indikator passt sich dank seines volatilitätsbewussten Designs natürlich jedem Instrument und Zeitrahmen an.
Anwendung
Trendfolge: Folgen Sie dem Trend in Richtung der Linie – kaufen Sie, wenn die Linie grün ist (unter dem Kurs), verkaufen oder bleiben Sie draußen, wenn die Linie rot ist (über dem Kurs).
Dynamische Unterstützung & Widerstand: Das aktive Band dient als Echtzeit-Unterstützung (bullisch) oder Widerstand (bärisch). Wenn der Kurs zur Linie zurückkehrt, ohne sie zu durchbrechen, ist das ein Fortsetzungssignal.
Einstiegssignale: Die Pfeilmarker (▲ / ▼) zeigen eine bestätigte Trendänderung an. Diese können als Einstiegssignale verwendet werden, besonders wenn sie mit anderen Konfluenzfaktoren in Ihrem Chart übereinstimmen.
Pivot-Referenz (optional): Aktivieren Sie "Hochs & Tiefs", um die vom Indikator intern verwendeten Swing-Pivot-Punkte anzuzeigen. Nützlich, um die Marktstruktur auf einen Blick zu verstehen.
Swing Flow vs. Standard SuperTrend
MerkmalStandard SuperTrendSwing Flow
Berechnungsgrundlage
Jede einzelne Kerze
Validierte Marktschwung-Pivots
Signalrauschen
Höher – reagiert auf jede Kerze
Niedriger – an Struktur verankert
Fehlsignale
Häufiger in unruhigen Märkten
Signifikant reduziert
Anpassungsfähigkeit
Fester ATR-Multiplikator
Volatilitätsgeglättete Bänder
Visueller Stil
Einzelne Linie
Einzelne Linie + Bänder + Mittellinie
Einstiegsbestätigung
Farbwechsel
Pfeil + Kurslabel bei Umkehr
Pivot-Sichtbarkeit
Keine
Optionale Pivot-Marker
Kurz gesagt: Swing Flow sieht aus wie SuperTrend, denkt aber wie ein Price-Action-Trader.
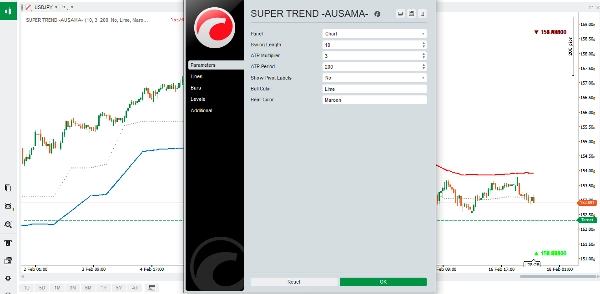
Eingabeparameter
ParameterStandardBeschreibung
Swing-Länge
10
Steuert die Empfindlichkeit der Pivot-Erkennung
ATR-Multiplikator
2.0
Bandbreite relativ zur Volatilität
ATR-Periode
200
Lookback für Volatilitätsmessung
Pivot-Beschriftungen anzeigen
Aus
Schwunghoch/-tief-Marker im Chart ein-/ausschalten
Bullenfarbe
Limette
Farbe für Aufwärtstrend
Bärenfarbe
Dunkelrot
Farbe für Abwärtstrend
Tipps für beste Ergebnisse
- Niedrigere Swing-Länge (5–8): Empfindlicher, mehr Signale – geeignet für Scalping oder aktiven Handel.
- Höhere Swing-Länge (14–20): Weniger, aber qualitativ hochwertigere Signale – geeignet für Swing- oder Positionshandel.
- Erhöhen Sie den ATR-Multiplikator in hochvolatilen Märkten (z. B. Krypto), um falsche Trendwechsel zu vermeiden.
- Verringern Sie den ATR-Multiplikator in stabilen, trendstarken Märkten für engere Signale.
- Am besten in Kombination mit Trendbestätigung aus höheren Zeitrahmen verwenden.
Swing Flow – Wo Marktstruktur auf Trendklarheit trifft.