Açıklama
Genel Bakış
Swing Flow, fiyat grafiğinde doğrudan görüntülenen gelişmiş bir trend takip göstergesidir ve size klasik SuperTrend'e benzer, temiz ve sezgisel bir görsel sinyal sunar — ancak temel olarak farklı ve daha sofistike bir mantıkla çalışır.
Standart trend göstergeleri her mumda tepki verirken, Swing Flow hesaplamalarını önemli piyasa dönüş noktalarına bağlar ve böylece baskın trendi çok daha az gürültü ve yanlış sinyal ile gerçekten yansıtan bir çizgi üretir.
Nasıl Çalışır (Formül Açıklanmadan)
Swing Flow, piyasadaki anlamlı pivot yüksekleri ve pivot düşükleri — fiyatın gerçekten döndüğü doğal dönüş noktalarını — tanımlar. Ardından bu pivotların etrafında dinamik bir orta seviye ve iki uyarlanabilir bant (üst ve alt) oluşturur, kısa vadeli dalgalanmaları filtrelemek için volatiliteye uyarlanmış yumuşatma uygular.
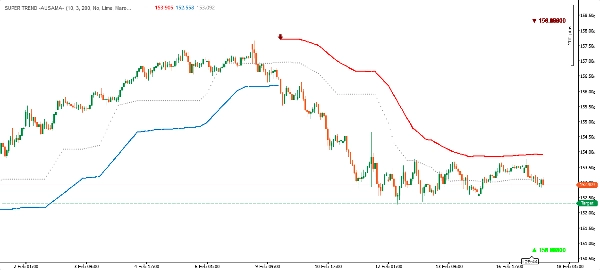
Sonuç, grafikte gösterilen tek bir trend çizgisi olur:
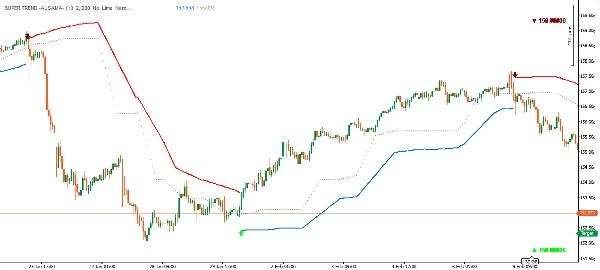
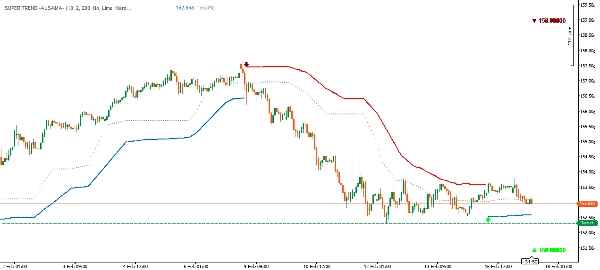
- 🟢 Fiyatın altında yeşil çizgi → Boğa trendi (dinamik destek görevi görür)
- 🔴 Fiyatın üstünde kırmızı çizgi → Ayı trendi (dinamik direnç görevi görür)
Trend değiştiğinde, çizgi taraf ve renk değiştirir — tıpkı SuperTrend gibi — bu da hemen fark edilir ve işlem yapılabilir hale gelir.
Gösterge Bileşenleri
BileşenAçıklama
Ana Trend Çizgisi
Birincil sinyal çizgisi — yükselen trendde fiyatın altında yeşil, düşen trendde üstünde kırmızı
Üst Bant
Ayı dönemlerinde gösterilen dinamik direnç seviyesi
Alt Bant
Boğa dönemlerinde gösterilen dinamik destek seviyesi
Orta Çizgi
Piyasa yapısından türetilen uyarlanabilir merkez çizgisi
Sinyal İşaretleri
Her trend dönüşünde fiyat etiketli yukarı/aşağı oklar
Pivot Etiketleri (isteğe bağlı)
Swing yüksek ve düşüklerinde elmas işaretçiler (açılıp kapatılabilir)
Temel Avantajlar
✅ Yapı Tabanlı Mantık
Çoğu trend göstergesinin sadece son fiyat hareketine baktığının aksine, Swing Flow gerçek swing pivot noktalarına dayanır — piyasanın kendisi tarafından önemli olarak doğrulanmış seviyeler. Bu, trend sinyalini temelde daha anlamlı kılar.
✅ Uyarlanabilir Volatilite Filtresi
Bantlar mevcut piyasa volatilitesine otomatik olarak uyum sağlar, sakin koşullarda daralır ve volatil dönemlerde genişler. Bu, manuel ayar gerektirmeden yanlış sinyalleri azaltır.
✅ Temiz SuperTrend-Stili Görünüm
Gelişmiş mantığına rağmen, görsel çıktı temiz ve tanıdıktır. Grafikte tek çizgi — altında yeşil, üstünde kırmızı. Karmaşa yok. Her zaman diliminde hemen okunabilir.
✅ Kesin Giriş Sinyalleri
Her trend değişikliği, yön okları ve dönüş barındaki tam kapanış fiyatı ile işaretlenir, böylece girişler için net bir referans noktası sağlar.
✅ Tam Renk Özelleştirme
Hem boğa hem ayı renkleri, grafik stilinize veya kişisel tercihinize uyacak şekilde tamamen özelleştirilebilir.
✅ Tüm Piyasalar ve Zaman Dilimlerinde Çalışır
Forex, endeksler, emtialar, kripto — gösterge volatiliteye duyarlı tasarımı sayesinde herhangi bir enstrüman ve zaman dilimine doğal olarak uyum sağlar.
Nasıl Kullanılır
Trend Takibi: Çizginin yönünde trendi takip edin — çizgi yeşil (fiyatın altında) olduğunda satın alın, çizgi kırmızı (fiyatın üstünde) olduğunda satın alma veya piyasada kalmayın.
Dinamik Destek ve Direnç: Aktif bant gerçek zamanlı destek (boğa) veya direnç (ayı) seviyesi olarak hizmet eder. Fiyat çizgiye geri döner ama kırmazsa, bu devam sinyalidir.
Giriş Sinyalleri: Ok işaretçileri (▲ / ▼) onaylanmış trend değişikliğini gösterir. Bunlar, özellikle grafiğinizdeki diğer uyumlarla hizalandığında giriş tetikleyicisi olarak kullanılabilir.
Pivot Referansı (isteğe bağlı): Gösterge tarafından dahili olarak kullanılan swing pivot noktalarını göstermek için "Yüksek & Düşük" seçeneğini etkinleştirin. Piyasa yapısını hızlıca anlamak için faydalıdır.
Swing Flow ve Standart SuperTrend Karşılaştırması
ÖzellikStandart SuperTrendSwing Flow
Hesaplama temeli
Her bir mum
Doğrulanmış piyasa swing pivotları
Sinyal gürültüsü
Daha yüksek — her bara tepki verir
Daha düşük — yapıya bağlı
Yanlış sinyaller
Dalgalı piyasalarda daha yaygın
Önemli ölçüde azalmış
Uyarlanabilirlik
Sabit ATR çarpanı
Volatiliteye uyarlanmış bantlar
Görsel stil
Tek çizgi
Tek çizgi + bantlar + orta seviye
Giriş onayı
Renk değişimi
Dönüşte ok + fiyat etiketi
Pivot görünürlüğü
Yok
İsteğe bağlı pivot işaretçileri
Kısaca: Swing Flow SuperTrend gibi görünür, ancak fiyat hareketi tüccarı gibi düşünür.
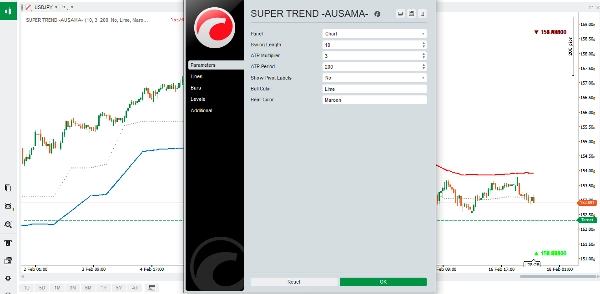
Girdi Parametreleri
ParametreVarsayılanAçıklama
Swing Uzunluğu
10
Pivot tespiti hassasiyetini kontrol eder
ATR Çarpanı
2.0
Volatiliteye göre bant genişliği
ATR Periyodu
200
Volatilite ölçümü için geriye bakış
Pivot Etiketlerini Göster
Kapalı
Grafikte swing yüksek/düşük işaretçilerini açıp kapatır
Boğa Rengi
Lime
Boğa trendi için renk
Ayı Rengi
Koyu Kırmızı
Ayı trendi için renk
En İyi Sonuçlar İçin İpuçları
- Daha Düşük Swing Uzunluğu (5–8): Daha hassas, daha fazla sinyal — scalping veya aktif işlem için uygundur.
- Daha Yüksek Swing Uzunluğu (14–20): Daha az, daha kaliteli sinyal — swing trading veya pozisyon trading için uygundur.
- ATR Çarpanını Artırın yüksek volatilite piyasalarında (örneğin kripto) yanlış dönüşleri önlemek için.
- ATR Çarpanını Azaltın stabil, trend piyasalarında daha sıkı sinyaller için.
- En iyi şekilde daha yüksek zaman dilimlerinden gelen trend onayıyla kullanılır.
Swing Flow — Piyasa yapısının trend netliğiyle buluştuğu yer.