
Squeeze Momentum Indicator 2.0version
Gösterge
54 i̇ndirmeler
Sürüm 1.0, Nov 2025
Windows, Mac
Açıklama
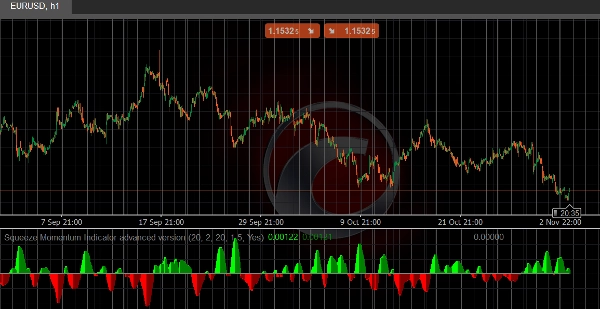
Bu cTrader göstergesi, düşük volatilite konsolidasyon dönemlerini ve potansiyel kırılma fırsatlarını belirlemek için tasarlanmış popüler Squeeze Momentum stratejisini uygular.
Nasıl Çalışır:
- Volatilite "sıkışma" koşullarını tespit etmek için Bollinger Bantlarını Keltner Kanalları ile karşılaştırır
- Doğrusal regresyon hesaplamaları kullanarak momentum gücünü ölçer
- Renk kodlu histogramlar ve dinamik sıfır çizgileri ile net görsel sinyaller sağlar
Ana Özellikler:
🎯 Sıkışma Tespiti - Bollinger Bantlarının Keltner Kanalları içine girdiği (sıkışma) ve genişlediği (kırılma) zamanları tanımlar
📊 Momentum Ölçümü - Histogram mevcut momentum gücünü ve yönünü gösterir
🎨 Görsel Sinyaller:
- Lime/Yeşil çubuklar: Boğa momentumu (güçlenme/zayıflama)
- Kırmızı/Koyu kırmızı çubuklar: Ayı momentumu (güçlenme/zayıflama)
- Mavi/Siyah/Gri sıfır çizgisi: Sıkışma yok/Sıkışma aktif/Sıkışma serbest bırakılıyor
Özelleştirilebilir Parametreler:
- BB Uzunluğu ve Çarpanı
- KC Uzunluğu ve Çarpanı
- Keltner Kanalı hesaplaması için TrueRange seçeneği
İçin Mükemmel:
- Konsolidasyon kırılmalarını tespit etmek
- Düşük volatilite dönemlerinde giriş zamanlaması yapmak
- Momentum yönünü doğrulamak
- Swing trading ve pozisyon trading
Özet
Gösterge profili
Müşteri değerlendirmeleri
0.0
Değerlendirmeler: 0
Müşteri değerlendirmeleri
Bu ürün için henüz bir değerlendirme yok. Ürünü denediniz mi? O zaman ona dair görüşlerini paylaşan ilk kişi olun!
Tartışma
SSS
Prop
Forex
Breakout
Indices
Commodities
Crypto
Stocks
Bollinger
cTrader Store üzerinden erişilebilen işlem botları, göstergeler ve eklentiler gibi ürünler, üçüncü taraf sağlayıcılar tarafından sağlanır ve yalnızca bilgilendirme ve teknik erişim amaçlarıyla sunulur. cTrader Store bir broker değildir ve yatırım tavsiyesi, kişisel öneriler vermez veya gelecekteki performansı garanti etmez.


Fiyat
10M
İşlem hacmi
10.64K
Kazanılan pip
23
Satışlar
1.23K
Ücretsiz yüklemeler