설명
🚀 10,000명 이상의 트레이더가 이미 우리의 TOP 지표를 사용하고 있습니다 🏆
전문가들이 왜 우리를 선택하는지 알아보세요 – cTrader에서 가장 강력한 도구들(지표, 알고리즘, cBots)이 여러분을 기다립니다.
👉 모든 TOP 시스템을 여기에서 받으세요:
📌 시장 구조 지표
- ✅ 고급 시장 구조: Bos, Choch, SwinLevels, 주문 블록, 시장 구조 및 유동성 탐색기
- 🔄 전환점의 동적 시장 구조 분석
- 🧱 주문 블록
- ⚖️ 시장 불균형
- ⛓️ BOS & CHOCH
- 🧠 ICT 파워 오브 3
- 🌀 시장 극성 구역
🔚 스마트 종료 시스템
📐 지그재그 지표
- 🔍 지그재그 가격 유동성 투영
- 🧭 S&R 구조적 지그재그
- ➖ 지그재그
- 🎯 지그재그 극한 추적기
🧱 지지 및 저항 지표
📊 추세 및 채널 지표
- 🔄 자동 추세 채널
- 📊 슈퍼트렌드
- 🧠 적응형 추세 채널
- 💥 채널 돌파 시스템
- 🌈 동적 추세 그라데이션
- ⭐ 프리미엄 SSL 채널
- 🔁 반응형 이동평균
💧 거래량 및 유동성 도구
- 🔥 거래량 POC 히트맵
- 📉 레버리지 청산 맵
- 🔍 모멘텀 공정 가치 갭
- 🕒 공정 가치 갭 세션
⚡ 모멘텀 및 RSI 지표
🔮 예측 및 투영 도구
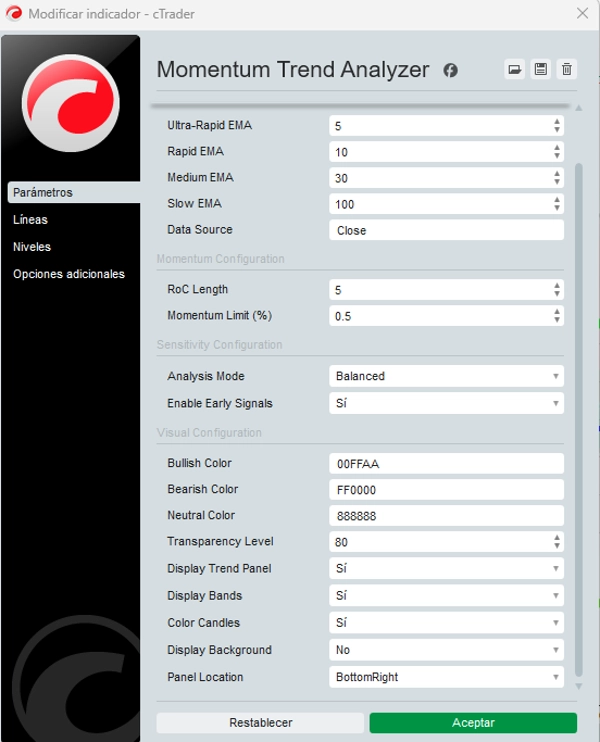
모멘텀 추세 분석기 🚀📊
시장 추세 방향을 식별하고강도를 평가하기 위해 설계된 고급 기술 알고리즘으로, 여러 분석 지표를 통합합니다. 이 지표는지수 이동평균(EMA), 변화율(RoC), 변동성, 상대 강도, 그리고 거래량을 결합하여 명확하고 실행 가능한 신호를 제공합니다. 아래에서는 기능과 계산 논리를 설명합니다.
핵심 구성 요소 🔧
이 알고리즘은 상호 작용하는다섯 가지 핵심 요소로 구성됩니다:
- 지수 이동평균(EMA) 📈
-
- 서로 다른 기간의네 가지 EMA(초고속, 고속, 중간, 저속)를 사용하며, 일반적으로 종가를 기준으로 계산됩니다.
- 단기 EMA(초고속 및 고속)는즉각적인 움직임을 감지하고, 장기 EMA(중간 및 저속)는지속적인 추세를 반영합니다.
- 변화율(RoC) ⚡
-
- 특정 기간 동안의가격 변동률을 측정하여 직접적인 모멘텀 지표로 사용합니다.
- 부드럽게 처리된 RoC는작은 변동을 걸러내고 신호를 안정화합니다.
- 정규화된 평균 진폭 범위(ATR) 🌪️
-
- ATR은과거 변동성을 정량화하며, 현재 가격으로 나누어 정규화하여 상대적 평가를 합니다.
- 높은 정규화 ATR은변동성 증가를 나타내며, 추세 강도 해석에 영향을 미칩니다.
- 상대 강도 지수(RSI) 💪
-
- 이 오실레이터는 가격 움직임의크기와 속도를 측정하며, 과매수/과매도 상태를 식별합니다.
- 추세 내에서의모멘텀 강도를 평가하는 데 도움을 줍니다.
- 평균 거래량 🔊
-
- 거래량의 단순 이동평균으로활발한 거래 기간을 감지하여 신호의 유효성을 강화합니다.
계산 논리 🧠
모멘텀 추세 분석기는 특정 조건과 계산의 조합을 통해 추세 및 강도 신호를 생성합니다:
1. 추세 결정
- 🟢 강세 추세: 빠른 EMA > 중간 EMA, 중간 EMA > 느린 EMA, 종가 > 빠른 EMA일 때 확인됩니다.
- 🔴 약세 추세: 빠른 EMA < 중간 EMA, 중간 EMA < 느린 EMA, 종가 < 빠른 EMA일 때 확인됩니다.
- ⚪ 중립 추세: 어느 조건도 충족하지 않을 때 발생하며, 이는 통합 또는 불확실성을 나타냅니다.
2. 초기 추세 신호 🔍
- 완전한 확인 전에잠재적 추세 전환을 감지합니다:
-
- 초고속 EMA
- 빠른 EMA 기울기
- 부드럽게 처리된 RoC
- 예: 초고속 EMA가 빠른 EMA를 상향 돌파하고, 빠른 EMA 기울기가 양수이며, 부드럽게 처리된 RoC가 모멘텀 임계값을 초과하면초기 강세 신호가 발생합니다.
3. 민감도 조정 ⚖️
세 가지 모드가 제공됩니다:
- 🛡️ 보수적: 확인된 신호를 우선시하여 오탐을 최소화합니다 (느린 감지).
- ⚔️ 공격적: 빠른 반응을 위해 초기 신호를 선호합니다 (높은 위험).
- ⚖️ 균형: 중간 접근법입니다.
4. 추세 강도 계산 💯
강도는 다음의가중 통합에서 도출됩니다:
- EMA 간격: 빠른 EMA와 느린 EMA 사이의 거리(%)
- RSI 기여도: RSI와 50의 차이(강세/약세)
- 변동성 (정규화된 ATR): 시장 변동성에 따른 강도 조정
- 상대 거래량: 현재 거래량이 평균보다 클 경우 강도 증가
- 모멘텀 (부드럽게 처리된 RoC): 움직임 속도 측정
- 결과: 0%에서 100% 사이의강도 백분율—높을수록 강력한 추세를 의미합니다.
5. 동적 밴드 🎯
- 최근 가격 고점/저점을 기반으로 한 세 개의 상/하 밴드
- 시장 변동성에 맞춰 조정되는동적 지지/저항 수준 역할을 합니다.
트레이더를 위한 실용적 적용 💼
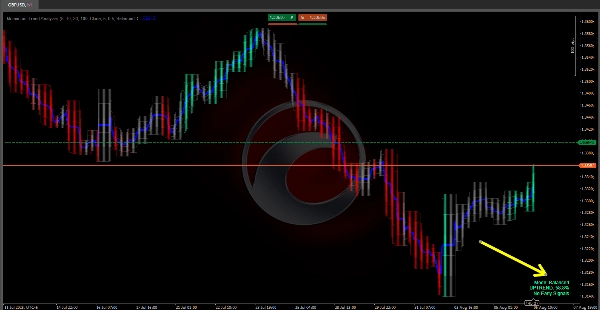
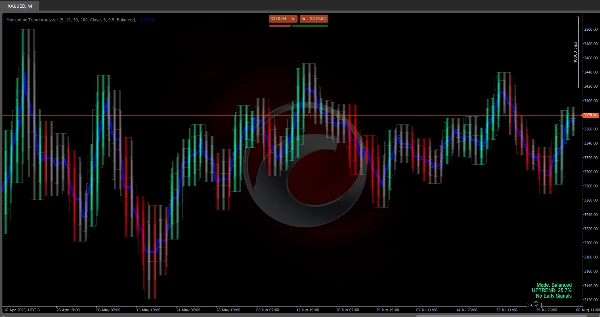
- 📊 시각화: 색상 음영(🟢 강세, 🔴 약세, ⚪ 중립)과 추세선으로 추세 표시
- 💪 강도: 백분율 값(예: 24.3% = 주의; >50% = 높은 신뢰도)
- 🔄 밴드 전략:
-
- 강세: 하단 밴드에서 매수, 상단 밴드에서 매도
- 약세: 상단 밴드에서 매도, 하단 밴드에서 커버
- 🚨 초기 신호: 공격적인 트레이더가 빠르게 움직이는 시장을 예측하는 데 도움
- 🛠️ 유연성: 민감도 모드는보수적(확인 대기) 또는 공격적(조기 행동) 스타일에 맞게 조정됩니다.
결론 🎯
모멘텀 추세 분석기는EMAs, RoC, 정규화된 ATR, RSI, 거래량을 결합하여포괄적인 추세 및 모멘텀 분석을 제공합니다. 명확한 조건과 가중 요소에 기반한 계산 논리는다양한 위험 수준과 거래 전략에 적응하여 트레이더에게 강력한 도구가 됩니다.
요약
The indicator determines bullish, bearish, or neutral trends based on EMA relationships and price positioning. It provides early trend shift signals using ultra-fast EMA, fast EMA slope, and smoothed RoC. Users can select from three sensitivity modes—conservative, balanced, and aggressive—to adjust signal responsiveness according to their trading style.
Trend strength is calculated as a weighted integration of EMA spread, RSI deviation from neutral, normalized volatility, relative volume, and momentum, expressed as a percentage from 0% to 100%. The indicator also features dynamic bands derived from recent price highs and lows, serving as adaptive support and resistance levels.
Visualization includes colored shading to indicate trend direction and a trendline, with strength values aiding decision-making. The band strategy suggests buying near lower bands and selling near upper bands in bullish trends, and the reverse in bearish trends. This tool supports diverse risk levels and trading strategies by providing comprehensive trend and momentum analysis.