
الوصف
HiLo Marker: اكتشف نقاط التحول الرئيسية في السوق
HiLo Marker هو مؤشر cTrader بديهي وأساسي مصمم لاكتشاف وتحديد أعلى وأدنى الأسعار المهمة تلقائيًا بناءً على نافذة تاريخية محددة. توفر هذه الأداة وضوحًا لرسومك البيانية من خلال إزالة التخمين عند تحديد نقاط التأرجح، مما يقدم ميزة بصرية لأي متداول حركة سعر.
كيف يعمل
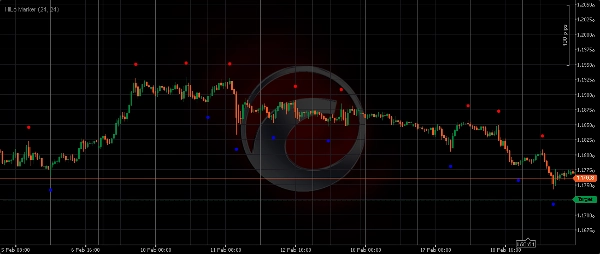
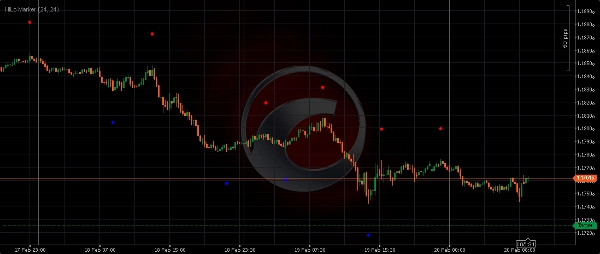
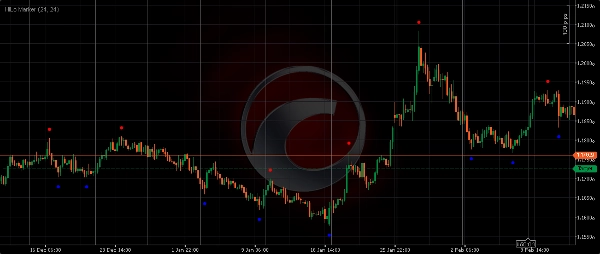
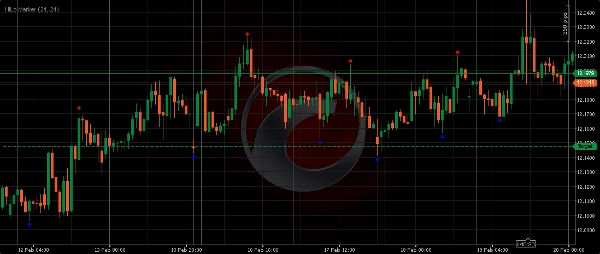
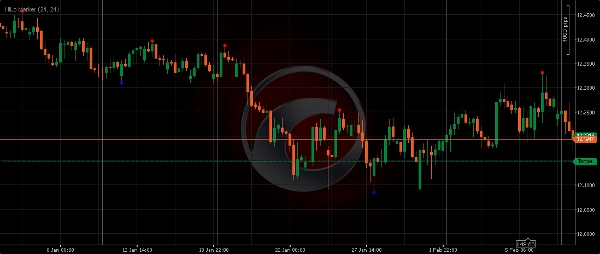
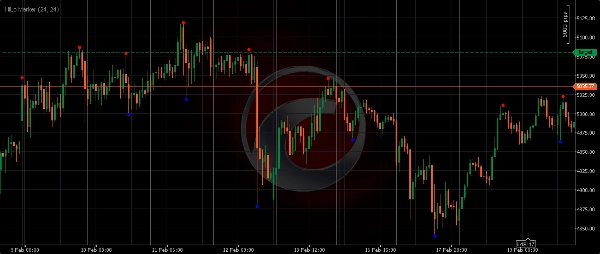
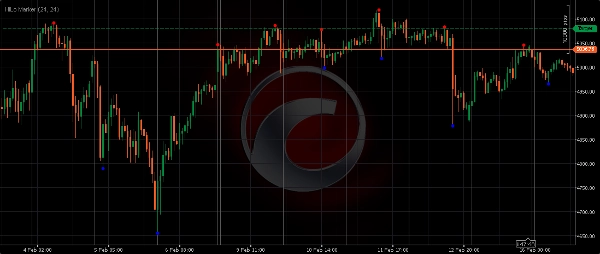
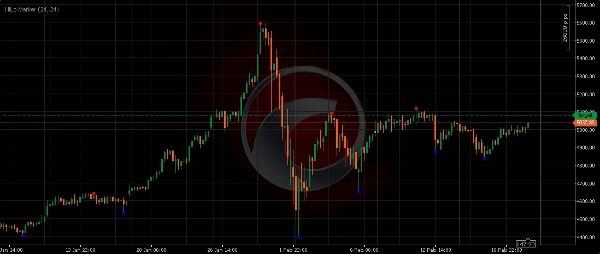
يقوم المؤشر بمسح "نافذة المسافة" المحددة (عدد الأشرطة) للعثور على أعلى قمة وأدنى قاع مطلق ضمن تلك النطاق. بمجرد تأكيد شريط كقمة أو قاع في نافذته المحيطة، HiLo Marker يضع نقطة حمراء أو زرقاء مميزة (أو سهم) فوق/تحت تلك الشمعة. تساعدك هذه الطريقة على تحديد المستويات الحاسمة بشكل موضوعي حيث انعكس السعر سابقًا أو وجد زخمًا قويًا.
الميزات والفوائد الرئيسية
- الدقة الآلية: لا حاجة لرسم الخطوط يدويًا بعد الآن. يحدد HiLo Marker نقاط التحول الحرجة بشكل موضوعي.
- هيكل السوق الواضح: تصور فوري للتأرجحات والاتجاهات والنطاقات، مما يجعل تحليل الرسوم البيانية أكثر كفاءة.
- مناطق الدعم والمقاومة: غالبًا ما تعمل القمم والقيعان المحددة كدعم ومقاومة مستقبلية، مما يوفر نقاط دخول/خروج ذات احتمالية عالية.
- متعدد الاستخدامات: يعمل بسلاسة عبر جميع الأدوات المالية (الفوركس، الذهب، المؤشرات، العملات المشفرة، الأسهم) وعلى أي إطار زمني.
- مرئيات قابلة للتخصيص: ضبط ألوان العلامات ومسافة الإزاحة لتكامل مثالي مع الرسم البياني.
شرح معلمات الإدخال:
- الطول (الإزاحة): تحدد هذه القيمة مدى ارتفاع العلامة فوق القمة أو أسفل القاع. القيمة الأكبر تخلق فصلًا بصريًا أكبر عن الشمعة.
-
- مثال:
Length = 24يعني أن العلامة ستظهر على بعد 24 نقطة (أو تيك، حسب الرمز) من القمة/القاع الفعلي.
- مثال:
- نافذة المسافة: هذه هي فترة النظر إلى الوراء التي يستخدمها المؤشر لتحديد قمة أو قاع. يتم تمييز الشريط فقط كقمة/قاع إذا كان هو الأعلى/الأدنى المطلق ضمن عدد الأشرطة المحيطة المحددة.
-
- أصغر
Dist(مثلاً، 10-20): يلتقط التأرجحات الصغيرة وضوضاء السوق قصيرة الأجل (مناسب للتداول السريع). - أكبر
Dist(مثلاً، 30-60+): يحدد التأرجحات الأكبر والأكثر أهمية على مستوى المؤسسات وانعكاسات الاتجاه الرئيسية (مثالي للتداول المتأرجح أو الأطر الزمنية الأعلى).
- أصغر
عزز تداول حركة السعر الخاص بك مع HiLo Marker. احصل على رؤية أوضح لديناميكيات السوق واتخذ قرارات أكثر وعيًا. قم بالتنزيل الآن!
الملخص
تقييمات العملاء
5 | 0 % | |
4 | 100 % | |
3 | 0 % | |
2 | 0 % | |
1 | 0 % |


