
Pulse Radar: Профессиональный анализ динамики импульса и циклов
Индикатор Pulse Radar представляет собой продвинутый аналитический набор для платформ на базе C#, разработанный для декодирования рыночной волатильности и выявления фаз развития цены с высокой вероятностью. В отличие от отстающих традиционных индикаторов, Pulse Radar использует адаптивную оценку зон равновесия цены, предоставляя чёткую структурную карту рынка.
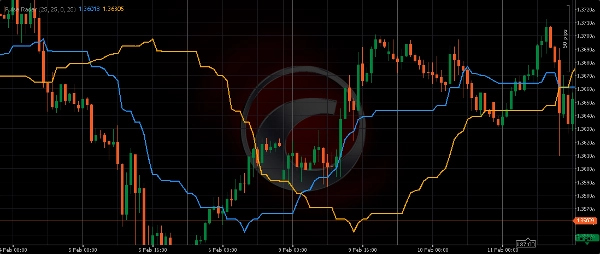
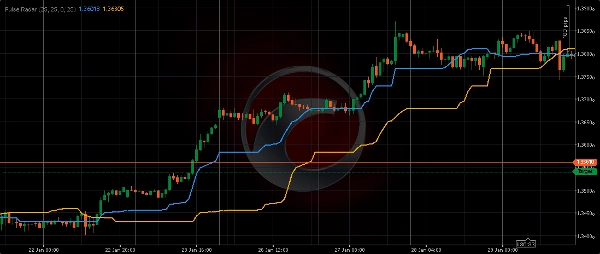
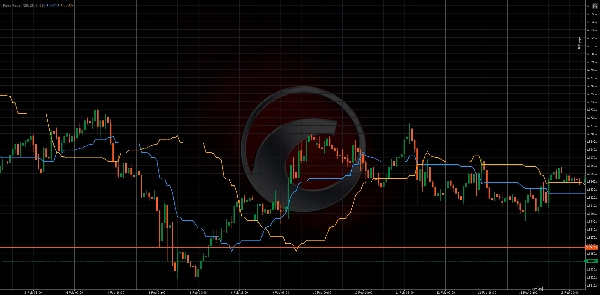
Система строит две собственные аналитические кривые:
- Активный вектор (быстрый): линия с высокой отзывчивостью, отражающая мгновенный импульс и краткосрочные изменения ликвидности.
- Стратегический вектор (медленный): сглаженная кривая, представляющая доминирующий рыночный цикл и институциональное равновесие цены.
Анализируя положение цены относительно этих кривых, трейдеры могут точно определить текущую фазу рынка в более широкой циклической иерархии. Pulse Radar также оснащён продвинутым историческим выравниванием, позволяющим напрямую сравнивать текущие структурные движения с прошлыми поведенческими паттернами.
Техническая методология
- Анализ экстремальных точек: линии вычисляются на основе исходных экстремумов цены в определённых окнах обратного просмотра, устраняя шум, присутствующий в стандартных скользящих средних.
- Синхронизация фаз: алгоритм поддерживает ручные и автоматические корректировки смещения для выравнивания данных с историческими сегментами графика.
- Структурное взаимодействие: сближение и расхождение Активного и Стратегического векторов подчёркивают переходы между фазами накопления и распределения тренда.
Ключевые преимущества
- Точность без сглаживания: вычисления используют исходные рыночные данные, обеспечивая отсутствие искусственной задержки.
- Адаптивная структура: полностью настраиваемые параметры для соответствия специфическому профилю волатильности любого актива.
- Межрыночная универсальность: оптимизирован для высокочастотного Forex, американских акций, сырьевых товаров и криптовалют.
- Высокопроизводительная архитектура: лёгкая логика на C# обеспечивает нулевое влияние на стабильность платформы во время высокой волатильности.
Входные параметры
- Период охвата (быстрый/медленный): определяет глубину рыночных данных, используемых для расчёта векторов импульса.
- Сдвиг фазы (быстрый/медленный): позволяет точно калибровать аналитические линии относительно исторических ценовых структур.
5 | 100 % | |
4 | 0 % | |
3 | 0 % | |
2 | 0 % | |
1 | 0 % |


