
Açıklama
GENEL BAKIŞ
Waddah Attar Patlaması (WAE) göstergesi Ahmad Waddah Attar tarafından oluşturulmuş ve 2007 yılında ticaret topluluğuna tanıtılmıştır. MACD momentum ölçümü ile Bollinger Bantları volatilite analizini birleştirerek "fiyat patlaması" anlarını—fiyatın konsolidasyondan güçlü yönlü harekete geçtiği dönemleri—belirler.
Gösterge iki soruya yanıt verir:
- Momentum artıyor mu? (MACD değişim hızı ile ölçülür)
- Volatilite genişliyor mu? (Bollinger Bantları genişliği ile ölçülür)
Her iki koşul da bir gürültü filtresi (Ölü Bölge) üzerinde hizalandığında, potansiyel bir patlayıcı hareket sinyali verir.
BİLEŞENLER
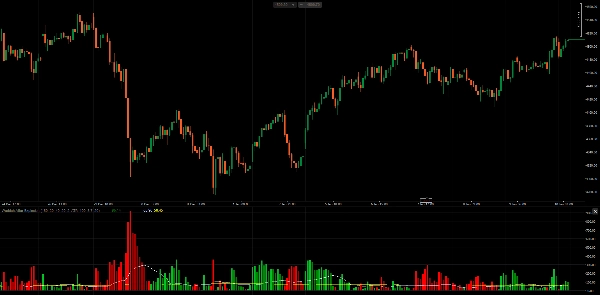
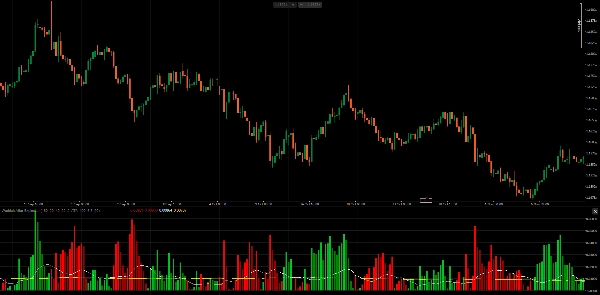
1. Trend Histogramı (Yeşil/Kırmızı) MACD çizgisinin değişim hızını, bir hassasiyet faktörü ile çarparak gösterir.
- Hesaplama:
(MACD_current - MACD_previous) × Sensitivity - Yeşil çubuklar: Boğa momentumu (MACD yukarı hızlanıyor)
- Kırmızı çubuklar: Ayı momentumu (MACD aşağı hızlanıyor)
- Parlak renk: Önceki çubuğa göre momentum artıyor
- Koyu renk: Önceki çubuğa göre momentum azalıyor
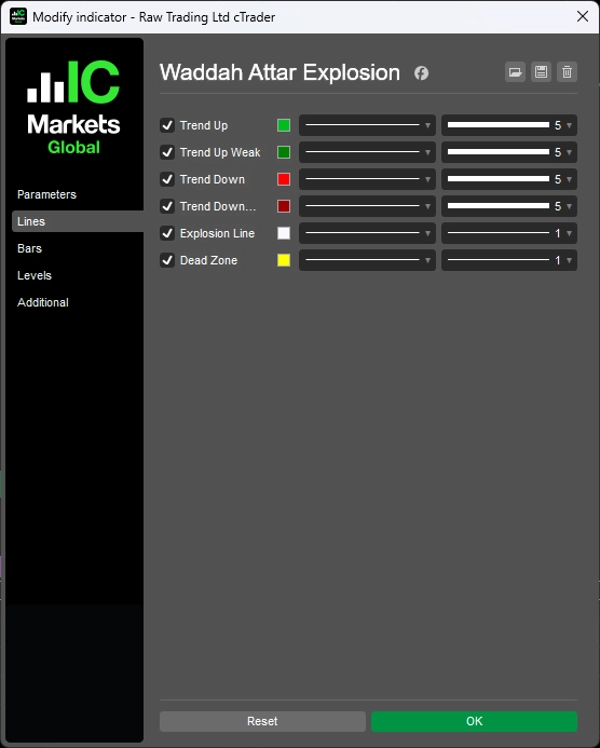
2. Patlama Çizgisi (Beyaz) Bollinger Bantlarının genişliğini temsil eder, volatilitenin genişlemesini veya daralmasını gösterir.
- Hesaplama:
BB_Upper - BB_Lower - Yükseliyor: Volatilite genişliyor (potansiyel kırılma)
- Düşüyor: Volatilite daralıyor (konsolidasyon)
3. Ölü Bölge (Sarı) Piyasa gürültüsünden kaynaklanan zayıf sinyalleri elemek için bir eşik filtresi.
- ATR tabanlı: Mevcut piyasa volatilitesine uyum sağlar
- Sabit Pips: Statik eşik değeri
AHMAD WADDAH ATTAR NASIL KULLANIYOR
Orijinal yazara göre:
Alış Giriş Kuralları Tüm koşullar sağlanmalıdır:
- Yeşil histogram yükseliyor
- Yeşil histogram Patlama Çizgisinin üzerinde
- Patlama Çizgisi yükseliyor
- Hem yeşil histogram hem de Patlama Çizgisi Ölü Bölgenin üzerinde
Satış Giriş Kuralları Tüm koşullar sağlanmalıdır:
- Kırmızı histogram yükseliyor
- Kırmızı histogram Patlama Çizgisinin üzerinde
- Patlama Çizgisi yükseliyor
- Hem kırmızı histogram hem de Patlama Çizgisi Ölü Bölgenin üzerinde
Çıkış Kuralları
- Yeşil histogram Patlama Çizgisinin altına düştüğünde uzun pozisyondan çık
- Kırmızı histogram Patlama Çizgisinin altına düştüğünde kısa pozisyondan çık
Ana Fikir Patlama Çizgisinin açısı önemlidir. Patlama Çizgisi yukarı eğimli ve histogram onun üzerine çıktığında, bu volatilitenin aktif olarak arttığını doğrular—"patlama" gerçek, sahte sinyal değildir.
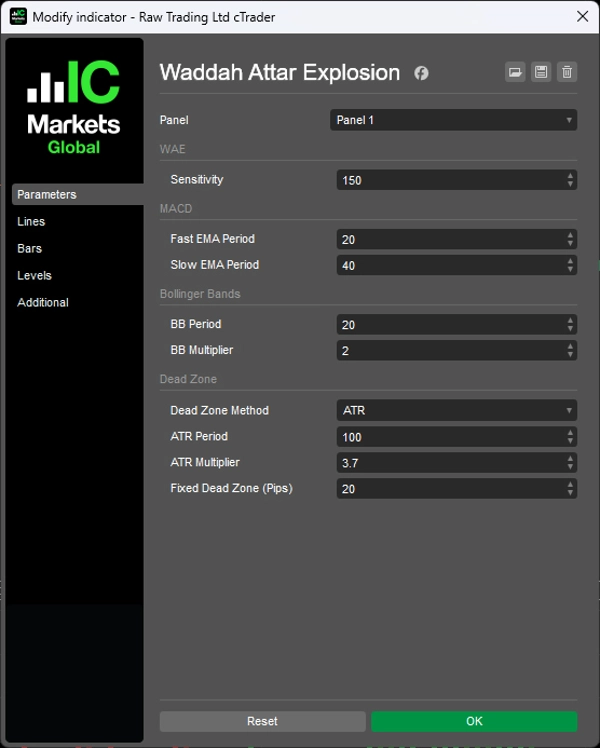
PARAMETRELER
1. Hassasiyet
- Hassasiyet (150): MACD değişim hızı için çarpan
2. MACD
- Hızlı EMA Periyodu (20): MACD hesaplaması için hızlı hareketli ortalama
- Yavaş EMA Periyodu (40): MACD hesaplaması için yavaş hareketli ortalama
3. Bollinger Bantları
- BB Periyodu (20): Bollinger Bantları geriye dönük periyodu
- BB Çarpanı (2.0): Standart sapma çarpanı
4. Ölü Bölge
- Ölü Bölge Yöntemi (ATR): ATR tabanlı veya Sabit Pips arasında seçim yapın
- ATR Periyodu (100): ATR hesaplama periyodu
- ATR Çarpanı (3.7): Ölü Bölge için ATR'ye uygulanan çarpan
- Sabit Ölü Bölge (20): Sabit yöntem kullanıldığında Ölü Bölge değeri pips olarak
NOTLAR
- Gösterge tüm zaman dilimlerinde çalışır. Orijinal yazar H1 ve M30'u önerdi.
- ATR tabanlı Ölü Bölge, farklı enstrümanlara ve piyasa koşullarına uyum sağladığı için önerilir.
- Hassasiyet parametresi zaman dilimi ve enstrüman volatilitesine göre ayarlanabilir.
- Bu gösterge momentumu ve volatilite uyumunu belirler—kendi başına yön tahmini yapmaz. Trend analizi veya destek/direnç seviyeleri ile birlikte kullanılması önerilir.
__________________________________________________________________________________________
DAHA FAZLA ÜCRETSİZ GÖSTERGE
Yapı ve hacimden regresyon, volatilite ve özel zaman dilimlerine kadar geniş bir piyasa analiz araçları yelpazesini keşfedin.
Kaynak kodu GitHub deposunda mevcuttur.
Tamamen ücretsizdir. Ancak kahve desteği göndermek isterseniz, buradan yönlendirebilirsiniz.
Destek/Direnç
Hacim
- Hacim Aktivite Profili
- Hacim Verimlilik Analizörü
- Hacim Profili Analitiği
- Hacim Profili - Güncellenmiş
- Hacim Yayılım Analizi
- VWAP (Hacim Ağırlıklı Ortalama Fiyat)
Hareketli Ortalamalar
- SSL Kanalı
- Çapa Hareketli Ortalaması
- Sapma Ölçekli Hareketli Ortalama
- Gann Yüksek Düşük Aktivatörü
- Anlık Trend Çizgisi
- Kaufman Adaptif MA Trend Vizyonu ile
- Hareketli Ortalama Kanalı
- Hareketli Ortalamalar Paketi
- Trend Kanalı Hareketli Ortalaması
Araçlar/Özel
Regresyon Tabanlı
Volatilite
Osilatörler
__________________________________________________________________________________________
FERAGATNAME
Ticaret risk içerir. Bu gösterge yalnızca teknik analiz amaçlıdır — her zaman uygun risk yönetimi uygulayın ve sorumlu şekilde işlem yapın.
GERİ BİLDİRİM & GELİŞTİRMELER
Önerileriniz, özellik talepleriniz veya geliştirme fikirleriniz varsa, lütfen Tartışma sekmesinde yorum bırakın. Geri bildiriminiz göstergenin herkes için iyileştirilmesine yardımcı olur.


