present
ลงทะเบียนและรับส่วนลด $50 สำหรับการซื้อครั้งแรกของคุณ
Trading product for Previous HLOC อินดิเคเตอร์ BTCUSD Forex, image 1
Previous HLOC
อินดิเคเตอร์
1 การซื้อ
เวอร์ชัน 2.0, Jan 2026
Windows, Mac
รีวิว: 3
Trading product for Previous HLOC อินดิเคเตอร์ BTCUSD Forex, image 2
Trading product for Previous HLOC อินดิเคเตอร์ BTCUSD Forex, image 3
Trading product for Previous HLOC อินดิเคเตอร์ BTCUSD Forex, image 4
ตั้งแต่ 23/03/2025
1
การขาย

คำอธิบาย

Previous HLOC – ระดับเวลาที่สูงกว่าที่ชาญฉลาดสำหรับการเทรดที่แม่นยำ

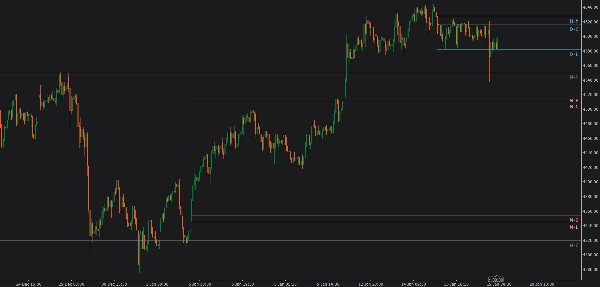
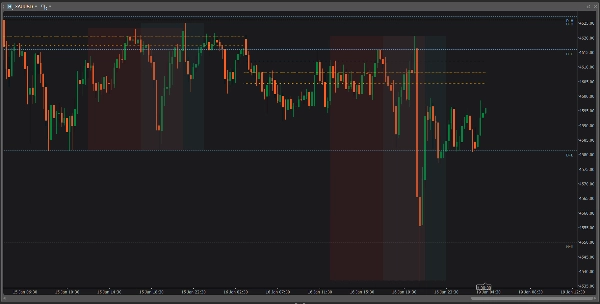
Previous HLOC เป็นตัวบ่งชี้หลายกรอบเวลามืออาชีพที่แสดง ระดับสูง ต่ำ เปิด และปิดของช่วงเวลาก่อนหน้า โดยตรงบนแผนภูมิของคุณด้วยความชัดเจนและการปรับแต่งที่เหนือชั้น

ออกแบบมาสำหรับ เทรดเดอร์ที่ใช้การเคลื่อนไหวของราคา, สแคปเปอร์, เทรดเดอร์รายวัน และเทรดเดอร์สวิง ตัวบ่งชี้นี้ช่วยให้คุณระบุได้ทันที ระดับสถาบันสำคัญ ที่มักทำหน้าที่เป็น แนวรับ แนวต้าน โซนปฏิเสธ และเป้าหมายสภาพคล่อง.


ทำไมต้อง Previous HLOC?

ตลาดตอบสนองอย่างสม่ำเสมอต่อ ระดับของวัน สัปดาห์ และเดือนก่อนหน้า สถาบัน อัลกอริทึม และเทรดเดอร์มืออาชีพติดตามระดับเหล่านี้อย่างใกล้ชิด
Previous HLOC นำราคาสำคัญเหล่านั้นมาไว้บนแผนภูมิของคุณในรูปแบบที่สะอาดและไม่มีสิ่งรบกวน—เพื่อให้คุณไม่พลาด


คุณสมบัติหลัก

✅ ระดับหลายกรอบเวลา

  • เลือก ระดับแท่งเทียนก่อนหน้ารายวัน รายสัปดาห์ รายเดือน หรือรายชั่วโมง
  • ระดับยังคงถูกต้องไม่ว่าจะใช้กรอบเวลาใดบนแผนภูมิของคุณ

✅ การควบคุม HLOC เต็มรูปแบบ

  • เปิดหรือปิดใช้งาน สูง ต่ำ เปิด ปิด แยกกัน
  • เทรดเฉพาะสิ่งที่สำคัญต่อกลยุทธ์ของคุณ

✅ การปรับแต่งขั้นสูง

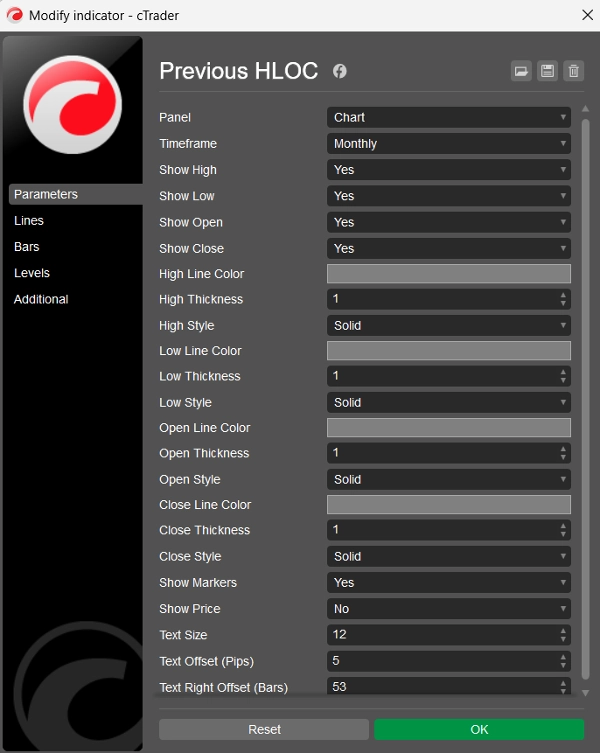
  • แยก สี ความหนา และสไตล์เส้น สำหรับแต่ละระดับ
  • เครื่องหมายฟอนต์ Consolas ที่สะอาดตา พร้อมขนาดข้อความที่ปรับได้
  • แสดงราคาตัวเลือกถัดจากเครื่องหมายแต่ละอัน

✅ เครื่องหมายลอยชาญฉลาด

  • เครื่องหมายเคลื่อนที่อย่างเป็นธรรมชาติกับแผนภูมิ
  • อยู่ในแนวเดียวกับระดับราคาเสมอขณะเลื่อน
  • วางไว้ทาง ด้านขวาเพื่อความชัดเจน

✅ ระดับที่คาดการณ์ในอนาคต

  • เส้นขยายไปไกลในอนาคต
  • เหมาะสำหรับ การวางแผนเข้าซื้อ ขาย หยุดขาดทุน และทำกำไร


🔹 วิธีที่เทรดเดอร์ใช้

📌 ระบุ แนวรับและแนวต้านภายในวันที่แข็งแกร่ง
📌 ใช้ระดับสูง/ต่ำก่อนหน้าเป็น โซนสแกนสภาพคล่อง
📌 เทรด การเบรคเอาท์ การปฏิเสธ และการทดสอบซ้ำ
📌 จัดตำแหน่งเข้าซื้อให้สอดคล้องกับ แนวโน้มกรอบเวลาที่สูงกว่า
📌 ปรับปรุง ความแม่นยำของความเสี่ยงและผลตอบแทน


🔹 ตัวบ่งชี้นี้เหมาะกับใคร?

✔ เทรดเดอร์ฟอเร็กซ์
✔ เทรดเดอร์ดัชนีและสินค้าโภคภัณฑ์
✔ สแคปเปอร์และเทรดเดอร์รายวัน
✔ เทรดเดอร์สวิง
✔ เทรดเดอร์ที่ใช้การเคลื่อนไหวของราคาและ SMC


🔹 สะอาด รวดเร็ว เชื่อถือได้

  • ไม่มีการวาดซ้ำ
  • ไม่มีความล่าช้า
  • ไม่มีความยุ่งเหยิง
  • ใช้งานได้กับ สัญลักษณ์และกรอบเวลาทุกประเภท


🔹 สรุป

Previous HLOC ไม่ใช่แค่ตัวบ่งชี้ระดับทั่วไป—แต่เป็น เครื่องมือเทรดมืออาชีพ ที่ช่วยให้คุณเทรดด้วย บริบท โครงสร้าง และความมั่นใจ.

ถ้าคุณเทรดรอบ ระดับช่วงเวลาก่อนหน้า ตัวบ่งชี้นี้ควรอยู่บนแผนภูมิของคุณ

สรุป

สรุปโดย AI
Previous HLOC is a professional multi-timeframe trading indicator that plots the previous period’s High, Low, Open, and Close levels directly on your chart. It supports daily, weekly, monthly, and hourly timeframes, maintaining accuracy across all chart timeframes. Users can enable or disable individual HLOC levels to tailor the indicator to their trading strategy.

Key features include advanced customization options such as separate color, thickness, and line style settings for each level, adjustable Consolas font markers with optional price display, and smart floating markers that stay aligned with price levels and positioned for clear visibility. The indicator extends these levels far into the future, aiding in planning entries, exits, stop-loss, and take-profit points.

Designed for price-action traders, scalpers, intraday, and swing traders, Previous HLOC helps identify key institutional levels that often act as support, resistance, rejection zones, and liquidity targets. It is applicable across various markets including Forex, indices, commodities, stocks, and cryptocurrencies.

The indicator operates without repainting or lag and works on all symbols and timeframes, providing a clean and reliable tool for trading with context, structure, and precision.
โปรไฟล์อินดิเคเตอร์

รีวิวจากลูกค้า

5.0
รีวิว: 3
5
100 %
4
0 %
3
0 %
2
0 %
1
0 %
รีวิวจากลูกค้า
February 2, 2026
The workspace is easier to scan, but it works better with a written plan.
February 2, 2026
the signal gets compared with context, but it should not replace the chart.
February 1, 2026
The first 10 trades should stay boring, and unclear signals stop looking so clean.

การสนทนา

คำถามที่พบบ่อย

BTCUSD
Forex
Signal
Breakout
Indices
EURUSD
Commodities
GBPUSD
NZDUSD
Prop
Scalping
SMC
Crypto
Stocks
XAUUSD
NAS100
USDJPY
ผลิตภัณฑ์ที่มีให้บริการผ่าน cTrader Store รวมถึงบอทการเทรด อินดิเคเตอร์ และปลั๊กอิน มีให้บริการโดยนักพัฒนาบุคคลที่สามและมีไว้เพื่อวัตถุประสงค์ในการเข้าถึงข้อมูลและทางเทคนิคเท่านั้น cTrader Store ไม่ใช่โบรกเกอร์และไม่ได้ให้คำแนะนำการลงทุน คำแนะนำส่วนบุคคล หรือการรับประกันผลการดำเนินงานในอนาคต

นอกจากนี้คุณยังอาจชอบ

อินดิเคเตอร์
ATR
RSI
+4
RSI bands drawn on price, confluence-scored BUY/SELL signals, an ATR stop with three targets
อินดิเคเตอร์
AI
Prop
+7
EMA Clouds, Multi-Timeframe (MTF) Overlay, Swing High/Low detection, and a smart Dashboard with neutral zone filtering.
"PivotLevels" โลโก้
เรตติ้งสูง
4.7
(4)
$25
/
$30
อินดิเคเตอร์
Prop
Forex
+4
It draws Pivot Levels on the chart.
"Major Tops and Bottoms" โลโก้
เรตติ้งสูง
4.2
(4)
$29
อินดิเคเตอร์
Signal
Scalping
Average accuracy of around 60% to 70% on 45min timeframes it is highly recommended to use stop losses
อินดิเคเตอร์
Prop
Forex
+2
⚔️ JPY Samurai Breakout Pro — Professional Breakout Indicator for cTrader ⚔️
อินดิเคเตอร์
Volume
Channel
+3
A higher-timeframe log-regression channel with a volume profile, Point of Control and session levels.
อินดิเคเตอร์
ATR
RSI
+4
Adaptive Ichimoku with nine-factor confluence scoring, five signal types, smart TP/SL and an MTF panel.
อินดิเคเตอร์
AI
MACD
+8
A precision-engineered indicator designed for traders who demand signal integrity across volatile markets.
อินดิเคเตอร์
Smart Liquidity Zones PRO auto-detects liquidity grabs, wicks, traps & manipulations — trade like the smart money.
อินดิเคเตอร์
ATR
BOS
+5
Know how strong each Supertrend flip is: scored BUY/SELL, structure stop + 3 targets, live win-rate dashboard, alerts.
อินดิเคเตอร์
Volume
Key Levels
+1
Fixed-grid volume profile: bull and bear volume at every price level, with Point of Control and value area.
อินดิเคเตอร์
Block Liquidity,indicator.Block Order, Liquids Stops, Signal Sentiment,signal correctio.
"overbought oversold" โลโก้
ยอดนิยม
5.0
(3)
$19
/
$29
อินดิเคเตอร์
AI
ATR
+27
Overbought Oversold Indicator
อินดิเคเตอร์
The Weekly Daily Levels indicator shows the OHLC, and mid-point prices for the previous day and week.
อินดิเคเตอร์
ATR
EMA
+2
Dense EMA rainbow + Pro tools & a tested engine — get more from your EMAs, your research base for EMA bots.
"ZigzagSR" โลโก้
ยอดนิยม
4.2
(4)
$19
/
$30
อินดิเคเตอร์
RSI
XAUUSD
+2
Automatic ZigZag swings with dynamic support & resistance levels, labeling highs/lows for clear trend signals.
"ZigZag Structure Pro" โลโก้
เรตติ้งสูง
4.2
(4)
$19
/
$20
อินดิเคเตอร์
Forex
BTCUSD
+12
🎯Automatically identifies the market's significant turning points (key H & L) and draws dynamic support and.....✍️
"MGC Trend Analysis 1.4" โลโก้
ยอดนิยม
4.6
(5)
$20
/
$40
อินดิเคเตอร์
Forex
BTCUSD
+5
Trend analysis, automatic analysis, position, swingtrader, scalper

ราคา

ตั้งแต่ 23/03/2025
1
การขาย