الوصف
مؤشرات متجر Pinescriptlabs: 🤖روبوتات متجر Pinescriptlabs:
خطوط الدعم والمقاومة SmartTrend جلسات اختراق الذهب و BTC(جديد) YieldShield" 🛡️
هيكل السوق الديناميكي
تحليل نقاط التحول
فيبوناتشي خطي
انحدار متعدد الأطر الزمنية
انحياز الشمعة متعدد المستويات
متعقب
دعم تلقائي و
خطوط اتجاه المقاومة
قوة ICT 3 ⚡📊
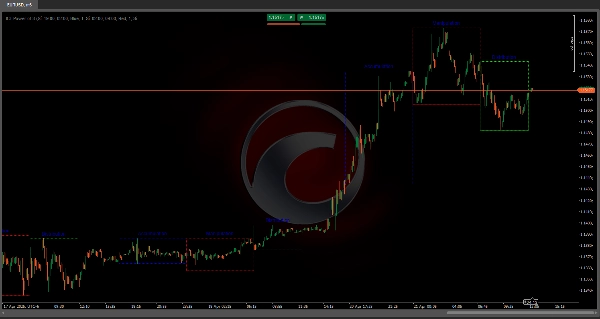
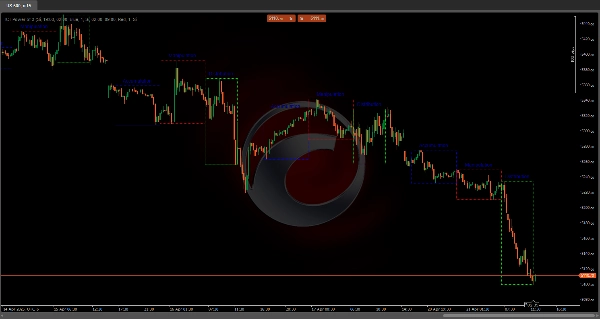
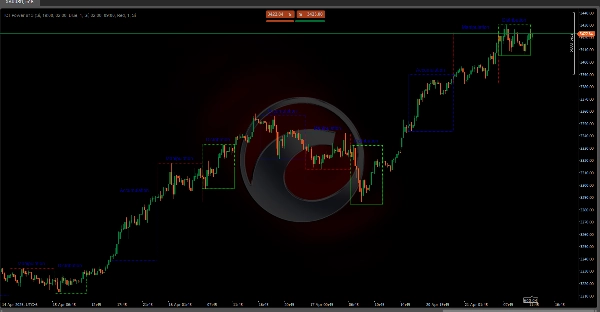
يقوم هذا المؤشر بأتمتة نظرية ICT "قوة 3" من خلال رسم ثلاث مناطق سوق رئيسية على الرسم البياني الخاص بك—التراكم، التلاعب، والتوزيع—باستخدام أطر زمنية محسنة تلتقط كل من الجلسات النقية وتداخلاتها. النتيجة هي "خريطة" 🗺️ توضح أين يضع اللاعبون الكبار الدعم، يصطادون الوقفات، ويدفعون الاتجاهات—لا حاجة لتحليل يدوي للشموع أو الفتائل!
لماذا هذا الخوارزم مهم في التداول 💡
رؤية مؤسسية 👀: من خلال أتمتة الكشف عن المناطق التي "المال الذكي" يتراكم ويتلاعب ويوزع فيها، تزيل التخمين وترى فوراً أين يتدفق السيولة الحقيقية.
كشف الفخ والسيولة 🎯: مرحلة التلاعب (تداخل أوروبا-نيويورك) هي حيث تحدث مطاردات الوقفات—رصد هذه يسمح لك بدخول الصفقات مع مخاطر أقل.
تأكيد الاتجاه 🚀: منطقة توزيع نيويورك النقية تلتقط جوهر الزخم الاتجاهي—التداول متزامناً معها يعزز معدلات النجاح.
الاتساق 🔄: استخدام أطر زمنية ثابتة ومرئيات موحدة يزيل التحيز العاطفي و يبسط اختبار الأداء الرجعي.
كشف المراحل الثلاث (تركيز على التداخل) 🔍
1️⃣ التراكم (تداخل آسيا + طوكيو/لندن: 7 مساءً – 2 صباحاً بتوقيت EST)
- البداية ⏳: عند أول شمعة 7 مساءً بتوقيت EST، يفتح "صندوق" يلتقط أعلى/أدنى نقطة مبدئية.
- التتبع 🔄: إذا كسر السعر النطاق (أعلى/أدنى جديد)، يتوسع الصندوق في الوقت الحقيقي.
- الإغلاق 🚪: عند 2 صباحاً بتوقيت EST، يُغلق الصندوق، معلمًا مكان المال الذكي الذي امتص الأوامر مع تقلب منخفض.
2️⃣ التلاعب (تداخل أوروبا + لندن/نيويورك: 2 صباحاً – 9 صباحاً بتوقيت EST)
- البداية ⏳: يُكتشف عند أول شمعة 2 صباحاً بتوقيت EST.
- السلوك 🎭: يبرز الاختراقات الكاذبة للقمم السابقة—يتم تتبع كل رفض بصريًا.
- الإغلاق 🚪: ينتهي عند 9 صباحاً بتوقيت EST، كاشفًا مكان مطاردات الوقفات المركزة.
3️⃣ التوزيع (جلسة نيويورك النقية: 9 صباحاً – 2 مساءً بتوقيت EST)
- البداية ⏳: تبدأ مع شمعة 9 صباحاً بتوقيت EST.
- التطور 📈: ينمو الصندوق مع أقوى اتجاه—حيث تقوم المؤسسات بإطلاق المراكز.
- الإغلاق 🚪: ينتهي عند 2 مساءً بتوقيت EST، معلمًا مرحلة أعلى زخم وحجم.
إدارة اليوم والتنظيف التلقائي 🧹
لتجنب ازدحام الرسم البياني، يحتفظ المؤشر فقط بـ آخر N أيام (قابل للتكوين). بمجرد تجاوزه، يقوم بحذف المناطق القديمة تلقائيًا—الحدود، التعبئة، والتسميات—محتفظًا بتحليلك نظيفًا ومركزًا على البيانات الحديثة.
الملخص
The indicator identifies:
1. Accumulation phase (7 PM – 2 AM EST, Asia + Tokyo/London overlap), marking where smart money absorbs orders with low volatility.
2. Manipulation phase (2 AM – 9 AM EST, Europe + London/New York overlap), highlighting false breakouts and stop hunts.
3. Distribution phase (9 AM – 2 PM EST, pure New York session), showing where institutions release positions during the highest momentum and volume.
ICT Power of 3 enhances trading by providing institutional visibility, trap and liquidity detection, and trend confirmation. It uses fixed timeframes and standardized visuals to reduce emotional bias and simplify backtesting. The indicator also manages chart clutter by automatically deleting old zones beyond a configurable number of days, keeping the analysis focused on recent data. It supports markets including commodities, cryptocurrencies (BTC, ETH), and symbols like BTCUSD and XAUUSD.
تقييمات العملاء
5 | 100 % | |
4 | 0 % | |
3 | 0 % | |
2 | 0 % | |
1 | 0 % |