
Description
SMARTRSI CLOUD SYSTEM - Advanced Momentum Analysis Tool
Transform your RSI analysis with this revolutionary indicator that combines Heikin Ashi smoothing technology with zero-centered RSI for crystal-clear momentum signals. Unlike traditional RSI indicators that can be noisy and difficult to interpret, SmartRSI Cloud System filters out market noise and highlights true directional momentum.
KEY FEATURES:
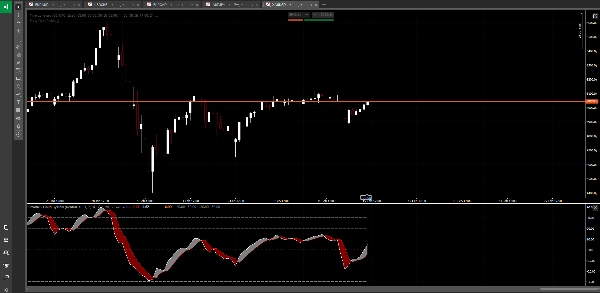
☁️ Heikin Ashi RSI Cloud
Experience smoothed momentum analysis with visual cloud formations. The cloud instantly shows you the strength and direction of market momentum, making trend identification effortless.
⚖️ Zero-Centered RSI
See momentum exactly as it is - centered at zero for clear bullish/bearish bias. Positive values indicate buyer strength, negative values show seller pressure. No more guessing if RSI is trending up or down.
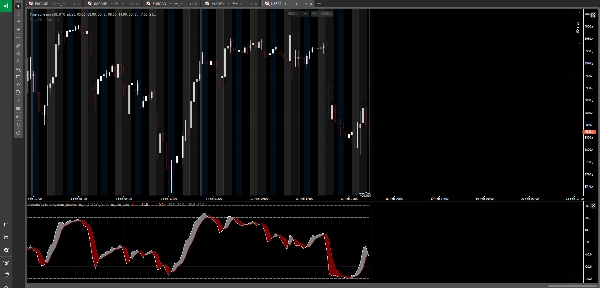
🎯 Smart Smoothing Technology
Eliminate false signals with intelligent RSI smoothing. The indicator applies Heikin Ashi principles to RSI calculations, dramatically reducing whipsaws while maintaining signal accuracy.
🔄 Adaptive Trader Modes
Switch between three trading modes:
• Neutral Mode - See all signals
• Buyers Mode - Filter for long opportunities only
• Sellers Mode - Filter for short opportunities only
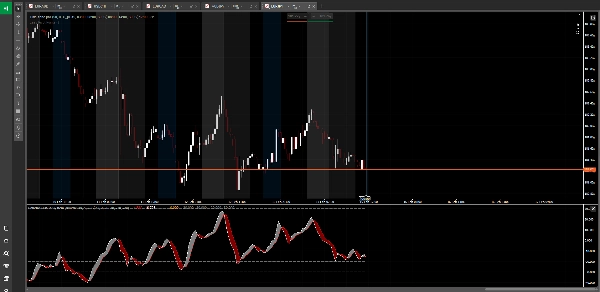
📊 Multi-Level Overbought/Oversold Zones
Four distinct levels help you gauge momentum extremes:
• Standard OB/OS levels for initial warnings
• Extreme OB/OS levels for reversal zones
• Fully customizable to match your trading style
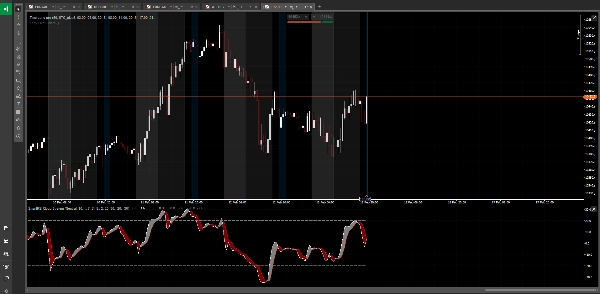
🎨 Professional Visualization
Clean, intuitive display with:
• Color-coded cloud formations
• Optional RSI plot line with customizable colors
• Clear boundary levels
• Zero line reference for instant bias recognition
⚙️ Fully Customizable
Adjust every aspect:
• HARSI length and smoothing parameters
• RSI calculation period
• Overbought/Oversold levels
• Visual elements and colors
• Trader mode preferences
PERFECT FOR:
• Identifying strong momentum trends
• Spotting divergences between price and momentum
• Timing entries in overbought/oversold conditions
• Filtering trades based on market bias
• Confirming breakouts and trend continuations
• Multi-timeframe momentum analysis
WHAT MAKES IT DIFFERENT:
Traditional RSI indicators show you raw momentum data that can be choppy and misleading. SmartRSI Cloud System applies institutional-grade smoothing while maintaining signal integrity. The zero-centered approach eliminates confusion about momentum direction, and the cloud visualization makes complex momentum patterns instantly recognizable.
Whether you're scalping, day trading, or swing trading, this tool gives you clarity on market momentum that standard indicators simply cannot provide.
---
⚠️ RISK DISCLAIMER:
Trading foreign exchange, cryptocurrencies, and other financial instruments carries a high level of risk and may not be suitable for all investors. The high degree of leverage can work against you as well as for you. Before deciding to trade, you should carefully consider your investment objectives, level of experience, and risk appetite. There is a possibility that you may sustain a loss of some or all of your investment. Therefore, you should not invest money that you cannot afford to lose. You should be aware of all the risks associated with trading and seek advice from an independent financial advisor if you have any doubts. Past performance is not indicative of future results.
Summary
Customer reviews
5 | 100 % | |
4 | 0 % | |
3 | 0 % | |
2 | 0 % | |
1 | 0 % |


