
คำอธิบาย
📊 ตัวบ่งชี้ประวัติ COT Pro — การไหลของนักแสดง + ทิศทาง (สถาบัน / ผู้ป้องกันความเสี่ยง / รายย่อย)
CotIndicatorHistoryPro นำเสนอข้อมูล Commitments of Traders (COT) ขั้นสูงโดยตรงบนแผนภูมิของคุณ พร้อมการแยกประเภทที่ชัดเจนตามผู้เข้าร่วมตลาด (สถาบัน, ผู้ป้องกันความเสี่ยง/พาณิชย์, รายย่อย)
มันแสดงไม่เพียงแต่ ตำแหน่งของแต่ละนักแสดง (ส่วนใหญ่เป็นการถือยาว/สั้น) แต่ยัง สิ่งที่พวกเขากำลังทำอยู่ตอนนี้ (เพิ่มตำแหน่งยาวหรือตำแหน่งสั้น) รวมถึงเส้น ทิศทาง สังเคราะห์เพื่อเน้นความลำเอียงที่มีอยู่
ตัวบ่งชี้โหลดชุดข้อมูลจาก ฟีด JSON ที่ปลอดภัย (HISTORY + OUTPUT) และจัดตำแหน่งอย่างปลอดภัยบนแผนภูมิ (ตัวเลือกป้องกันการมองล่วงหน้าโดยใช้ PublicationDate)
🗓️ การอัปเดตข้อมูลรายสัปดาห์ (วันศุกร์ 21:00)
ชุดข้อมูล COT จะ อัปเดตทุกวันศุกร์เวลา 21:00 (เวลายุโรป/โรม) ด้วยกระบวนการอัตโนมัติที่ทุ่มเท:
สคริปต์การประมวลผลที่ซับซ้อนทำการคำนวณและ เผยแพร่ค่าที่อัปเดตไปยังฟีด JSON ที่ตัวบ่งชี้ใช้ (และระบบนิเวศ cBot ที่เกี่ยวข้องหากติดตั้ง)
✅ ตัวบ่งชี้จะรีเฟรชบนแพลตฟอร์มโดยใช้การตั้งค่า Refresh Seconds ของคุณและจะแสดงข้อมูลรายสัปดาห์ใหม่ทันทีที่มีการเผยแพร่
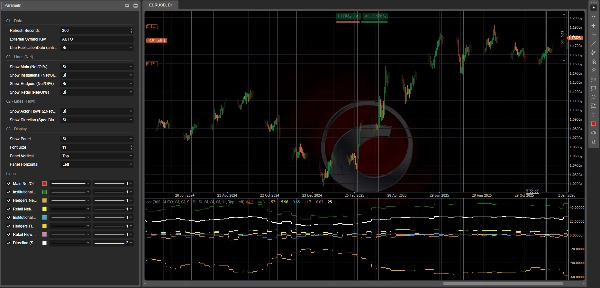
✅ สิ่งที่คุณจะได้รับ (เส้น + แผง)
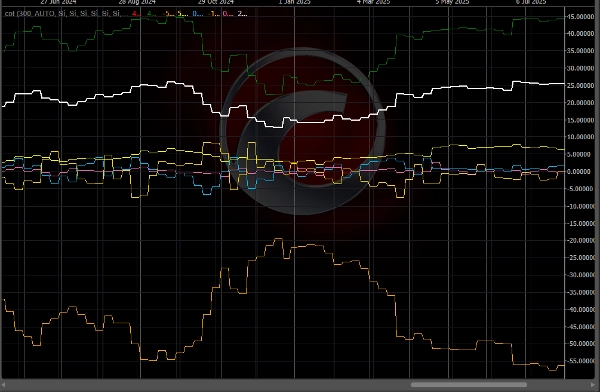
🔥 เส้น “Flow” (3 นักแสดง) — ΔNet/OI%
เส้นเหล่านี้แสดงถึง การเปลี่ยนแปลงตำแหน่งสุทธิรายสัปดาห์ โดยปรับตาม Open Interest:
- 🔵 การไหลของสถาบัน (ΔNet/OI%)
- 🟡 การไหลของผู้ป้องกันความเสี่ยง / พาณิชย์ (ΔNet/OI%)
- 💗 การไหลของรายย่อย (ΔNet/OI%)
📌 วิธีอ่าน:
- เหนือ 0 ⇒ นักแสดงกำลัง เพิ่มตำแหน่ง LONG สุทธิ (เพิ่มตำแหน่งยาวและ/หรือปิดตำแหน่งสั้น)
- ต่ำกว่า 0 ⇒ นักแสดงกำลัง เพิ่มตำแหน่ง SHORT สุทธิ (เพิ่มตำแหน่งสั้นและ/หรือลดตำแหน่งยาว)
- ค่าที่มีค่าสัมบูรณ์มากขึ้น (เช่น ±1.5%, ±3%) ⇒ การเปลี่ยนแปลงตำแหน่งที่แข็งแกร่งและมีความหมายมากขึ้น
🧭 เส้น “Direction” — ความลำเอียงของนักเก็งกำไร Net/OI%
- ⚪ ทิศทาง (ความลำเอียงของนักเก็งกำไร) Net/OI% สรุปทิศทาง “เก็งกำไร” ที่มีอยู่ (ค่าเฉลี่ยของสถาบัน + รายย่อย พร้อมตัวสำรองหากจำเป็น)
📌 วิธีอ่าน:
- > 0 ⇒ ความลำเอียงของนักเก็งกำไร LONG
- < 0 ⇒ ความลำเอียงของนักเก็งกำไร SHORT
- ≈ 0 ⇒ ช่วง FLAT / เป็นกลาง
🧩 แผงข้อมูล (บริบทเต็ม)
แผงในตัวแสดง:
- 📄 วันที่รายงาน / วันที่เผยแพร่
- 📌 Open Interest + WoW (การเปลี่ยนแปลงรายสัปดาห์)
- 🎯 สัญญาณข้อความ (ถ้ามีใน OUTPUT)
- สำหรับแต่ละนักแสดง:
-
- ความลำเอียง (ส่วนใหญ่ LONG / SHORT / FLAT) ตาม Net
- Net/OI%
- การไหล (ΔNet/OI%)
- WoW ΔLong / ΔShort / ΔNet เพื่อเข้าใจ วิธีที่ ตำแหน่งเปลี่ยนแปลง
🧠 วิธีอ่าน (ง่าย & ใช้งานได้จริง)
✅ การไหล vs ความลำเอียง (ความแตกต่างหลัก)
- การไหล = สิ่งที่พวกเขากำลังทำอยู่ตอนนี้ (เพิ่มตำแหน่งยาวหรือตำแหน่งสั้น)
- ความลำเอียง = วิธีที่พวกเขาตั้งตำแหน่งโดยรวม (ส่วนใหญ่ถือยาวหรือตำแหน่งสั้น)
ตัวอย่าง:
- สถาบัน ความลำเอียง LONG + การไหลบวก ⇒ พวกเขายังคงผลักดันตำแหน่งยาว
- สถาบัน ความลำเอียง LONG + การไหลลบ ⇒ การลดตำแหน่งยาว / อาจมีการหมุนเวียน
🚦 สถานการณ์การซื้อขายทั่วไป
✅ สถานการณ์ A — การยืนยันแนวโน้ม
- ทิศทาง > 0
- การไหลของสถาบัน > 0
➡️ แรงกดดันจากตำแหน่งยาวสอดคล้องกัน: มักเป็นการตั้งค่าต่อเนื่อง
✅ สถานการณ์ B — การกลับตัวที่เป็นไปได้ (Smart Money vs รายย่อย)
- การไหลของสถาบัน > 0 ขณะที่การไหลของรายย่อย < 0
➡️ รายย่อยขาย/เปิดตำแหน่งสั้น ขณะที่สถาบันซื้อ: อาจเป็นการสะสม
(ตรงกันข้าม = อาจเป็นการกระจาย)
✅ สถานการณ์ C — ผู้ป้องกันความเสี่ยงเป็น “สัญญาณเตือน”
- ผู้ป้องกันความเสี่ยงที่ระดับสุดขีด (Net/OI ห่างจากกลาง) + การไหลที่แข็งแกร่ง
➡️ โซนเกินพิกัด / การป้องกันความเสี่ยงอย่างรุนแรง (มักดีกว่าเป็นคำเตือนมากกว่าตัวกระตุ้นการเข้าโดยตรง)
✅ สถานการณ์ D — ตลาด “สะสม” (ความเสี่ยงการเบรกเอาต์)
- การไหลที่แข็งแกร่ง + Open Interest WoW เพิ่มขึ้น
➡️ ตำแหน่งใหม่กำลังเข้ามา: ความน่าจะเป็นของการเคลื่อนไหวขยายตัวมักเพิ่มขึ้น
⚡ รูทีนการอ่าน 10 วินาที
- ตรวจสอบ ทิศทาง: LONG (>0) หรือ SHORT (<0)
- ตรวจสอบ การไหลของสถาบัน: ยืนยันหรือแตกต่าง?
- ตรวจสอบ การไหลของรายย่อย: ยืนยันหรือทำตรงกันข้าม?
- ตรวจสอบ Open Interest WoW: ขยายตัวหรือปลดตำแหน่ง?
✅ สัญลักษณ์ที่รองรับ + ตำนานสำคัญ (คีย์สัญลักษณ์ JSON)
ตัวบ่งชี้สามารถวิเคราะห์ เครื่องมือใดก็ได้ที่มีในฟีด JSON (ฟิลด์ data[].symbol ใน OUTPUT)
วิธีเลือกเครื่องมือที่ถูกต้อง
- คีย์สัญลักษณ์ภายนอก = AUTO 👉 ใช้สัญลักษณ์แผนภูมิอัตโนมัติ (และลบส่วนต่อท้ายหลัง “.” เช่น
US2000.ecn→US2000) - ถ้าโบรกเกอร์ของคุณใช้ชื่อสัญลักษณ์ต่างกัน 👉 ตั้งค่า คีย์สัญลักษณ์ภายนอก เป็น คีย์ JSON ที่ถูกต้อง (ไม่สนใจตัวพิมพ์)
คีย์ปัจจุบันในฟีด (ตัวอย่างภาพรวม: reportDate 2026-02-17, publicationDate 2026-02-20)
- FX:
AUDUSD,EURUSD,GBPUSD,USDMXN - ดัชนี:
US100,US2000,DOW30,VIX - สินค้าโภคภัณฑ์/โลหะ/เกษตรกรรม:
BRENT,WTI,COPPER,CORN,WHEAT,XAU(ทองคำ),XAG(เงิน) - คริปโต:
BTC,ETH
📌 หากคุณไม่เห็นค่าบนแผนภูมิ:
- ตรวจสอบว่าสัญลักษณ์แผนภูมิตรงกับคีย์ JSON
- ตั้งค่า คีย์สัญลักษณ์ภายนอก ด้วยตนเอง (เช่น
ETH,US2000) - ตรวจสอบแผง วันที่รายงาน/วันที่เผยแพร่ เพื่อยืนยันว่าชุดข้อมูลล่าสุดถูกโหลดแล้ว
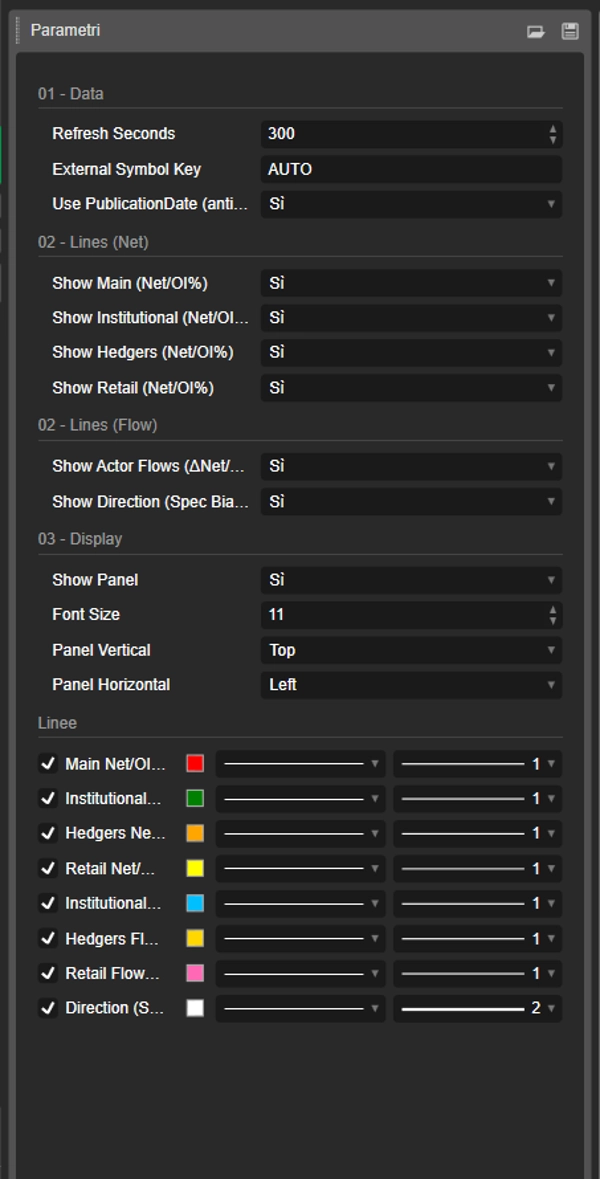
⚙️ หมายเหตุ
- รองรับการจัดตำแหน่งที่ปลอดภัยขึ้นด้วย ใช้ PublicationDate (ป้องกันการมองล่วงหน้า) ✅
- เส้นและแผงสามารถเปิด/ปิดได้แยกกัน
📌 ข้อจำกัดความรับผิดชอบ: ตัวบ่งชี้เพื่อข้อมูลเท่านั้น ไม่ใช่คำแนะนำทางการเงิน ข้อมูล COT เป็นรายสัปดาห์และควรพิจารณาร่วมกับแนวโน้ม ระดับสำคัญ และความผันผวน
สรุป
The indicator sources data from a secured JSON feed updated every Friday at 21:00 (Europe/Rome time) and aligns it on the chart using publication dates to prevent lookahead bias. Users can view flow lines for each actor, a direction line indicating overall market bias, and an info panel detailing report dates, open interest, net positions, and weekly changes.
It supports a wide range of instruments including Forex pairs (e.g., EURUSD, GBPUSD), indices (e.g., US100, DOW30), commodities (e.g., Brent, Gold), and cryptocurrencies (BTC, ETH). Symbol selection can be automatic or manually set to match feed keys.
Typical use cases include trend confirmation, spotting potential reversals by comparing smart money and retail flows, hedger activity alerts, and breakout risk assessment based on open interest changes. The indicator is informational and designed to complement other technical analysis tools.
รีวิวจากลูกค้า
5 | 50 % | |
4 | 50 % | |
3 | 0 % | |
2 | 0 % | |
1 | 0 % |


