

Description
Ultimate RSI (Relative Strength Index)
The Ultimate RSI is an advanced and customized oscillator designed to deliver a smoother, cleaner, and more responsive reading of market momentum and trend strength. It represents a significant upgrade over the traditional Relative Strength Index (RSI), focusing on filtering out market noise and minimizing false signals (whipsaws). This makes it an invaluable tool for confirming trends and pinpointing reliable turning points.
Key Features and Enhancements:
- Augmented Momentum Calculation: The indicator uses a sophisticated method to calculate price change. Instead of relying solely on daily price movements, the momentum signal is significantly reinforced when the price records a new high or a new low within the lookback period. This process ensures the indicator reacts powerfully to genuine breakouts while ignoring minor, choppy movements.
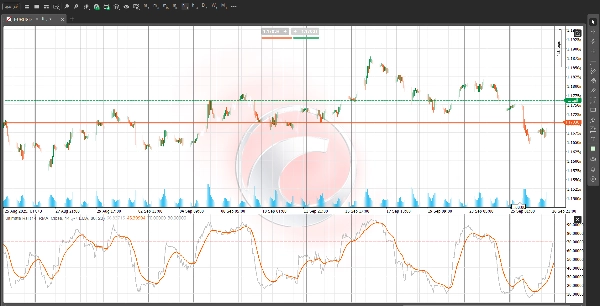
- Dedicated Signal Line: It includes a distinct Signal Line (a moving average of the RSI itself) that can be configured independently. Crossovers between the Ultimate RSI line and its Signal Line are often used as clearer, higher-confidence triggers for entries or exits, especially near overbought/oversold levels.
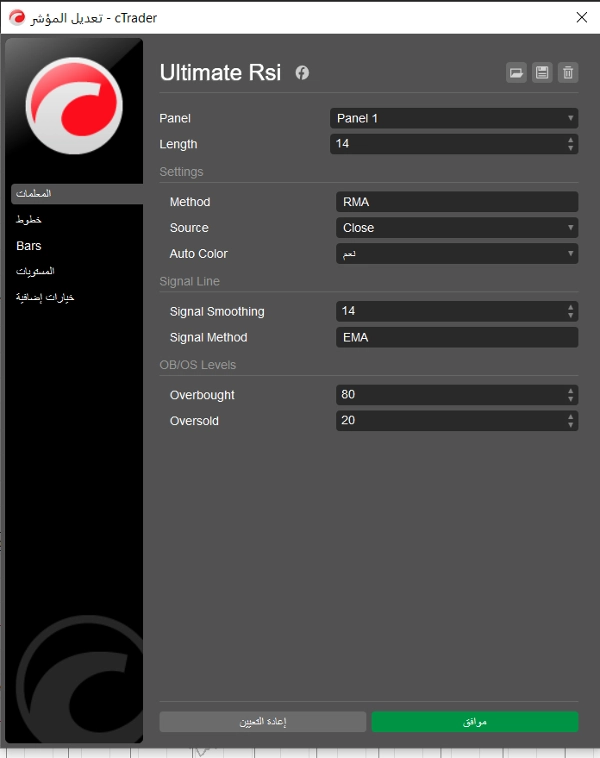
- Flexible Smoothing Methods: Users have the flexibility to select the smoothing type for both the RSI calculation and the Signal Line from common options: EMA (Exponential Moving Average), SMA (Simple Moving Average), RMA (Wilder's Moving Average), and TMA (Triangular Moving Average). This allows for precise customization of the indicator's sensitivity.
- Visual OB/OS Zones: The default overbought (OB) level at 80 and oversold (OS) level at 20 are clearly marked with background shading. In strong trending markets, sustained readings within these zones often indicate exceptional trend strength rather than an immediate reversal, offering a powerful confirmation tool for trend-following strategies.
How to Trade with the Ultimate RSI:
- Trend Confirmation: Use the 50-level as a momentum center. A reading consistently above 50 confirms a bullish bias, while a reading below 50 confirms a bearish bias.
- Entry Signals: Look for the Ultimate RSI line to cross above the Signal Line for a potential long entry, and to cross below the Signal Line for a potential short entry, paying close attention to where these crossovers occur relative to the 50-level.
- Noise Reduction: By emphasizing true range expansion and utilizing advanced smoothing, the Ultimate RSI helps traders maintain focus during periods of consolidation, preventing premature entries or exits.
Disclaimer: This description is for informational and educational purposes only. Trading involves risk, and all indicator readings should be combined with comprehensive price action analysis for any trading decisions.
Summary
Indicator profile
Customer reviews
0.0
Reviews: 0
Customer reviews
No reviews for this product yet. Already tried it? Be the first to tell others!
Discussion
FAQ
Prop
Forex
Indices
Supertrend
Commodities
RSI
Crypto
Stocks
ATR
Products available through cTrader Store, including trading bots, indicators and plugins, are provided by third-party developers and made available for informational and technical access purposes only. cTrader Store is not a broker and does not provide investment advice, personal recommendations or any guarantee of future performance.









!["High-Low Divergence [Iridio Capital]" logo](https://cdn.ctrader.com/image/webp/10a9e91b-243a-43f6-bbfe-7376bad5a214_61554)







Price
Since 03/09/2025